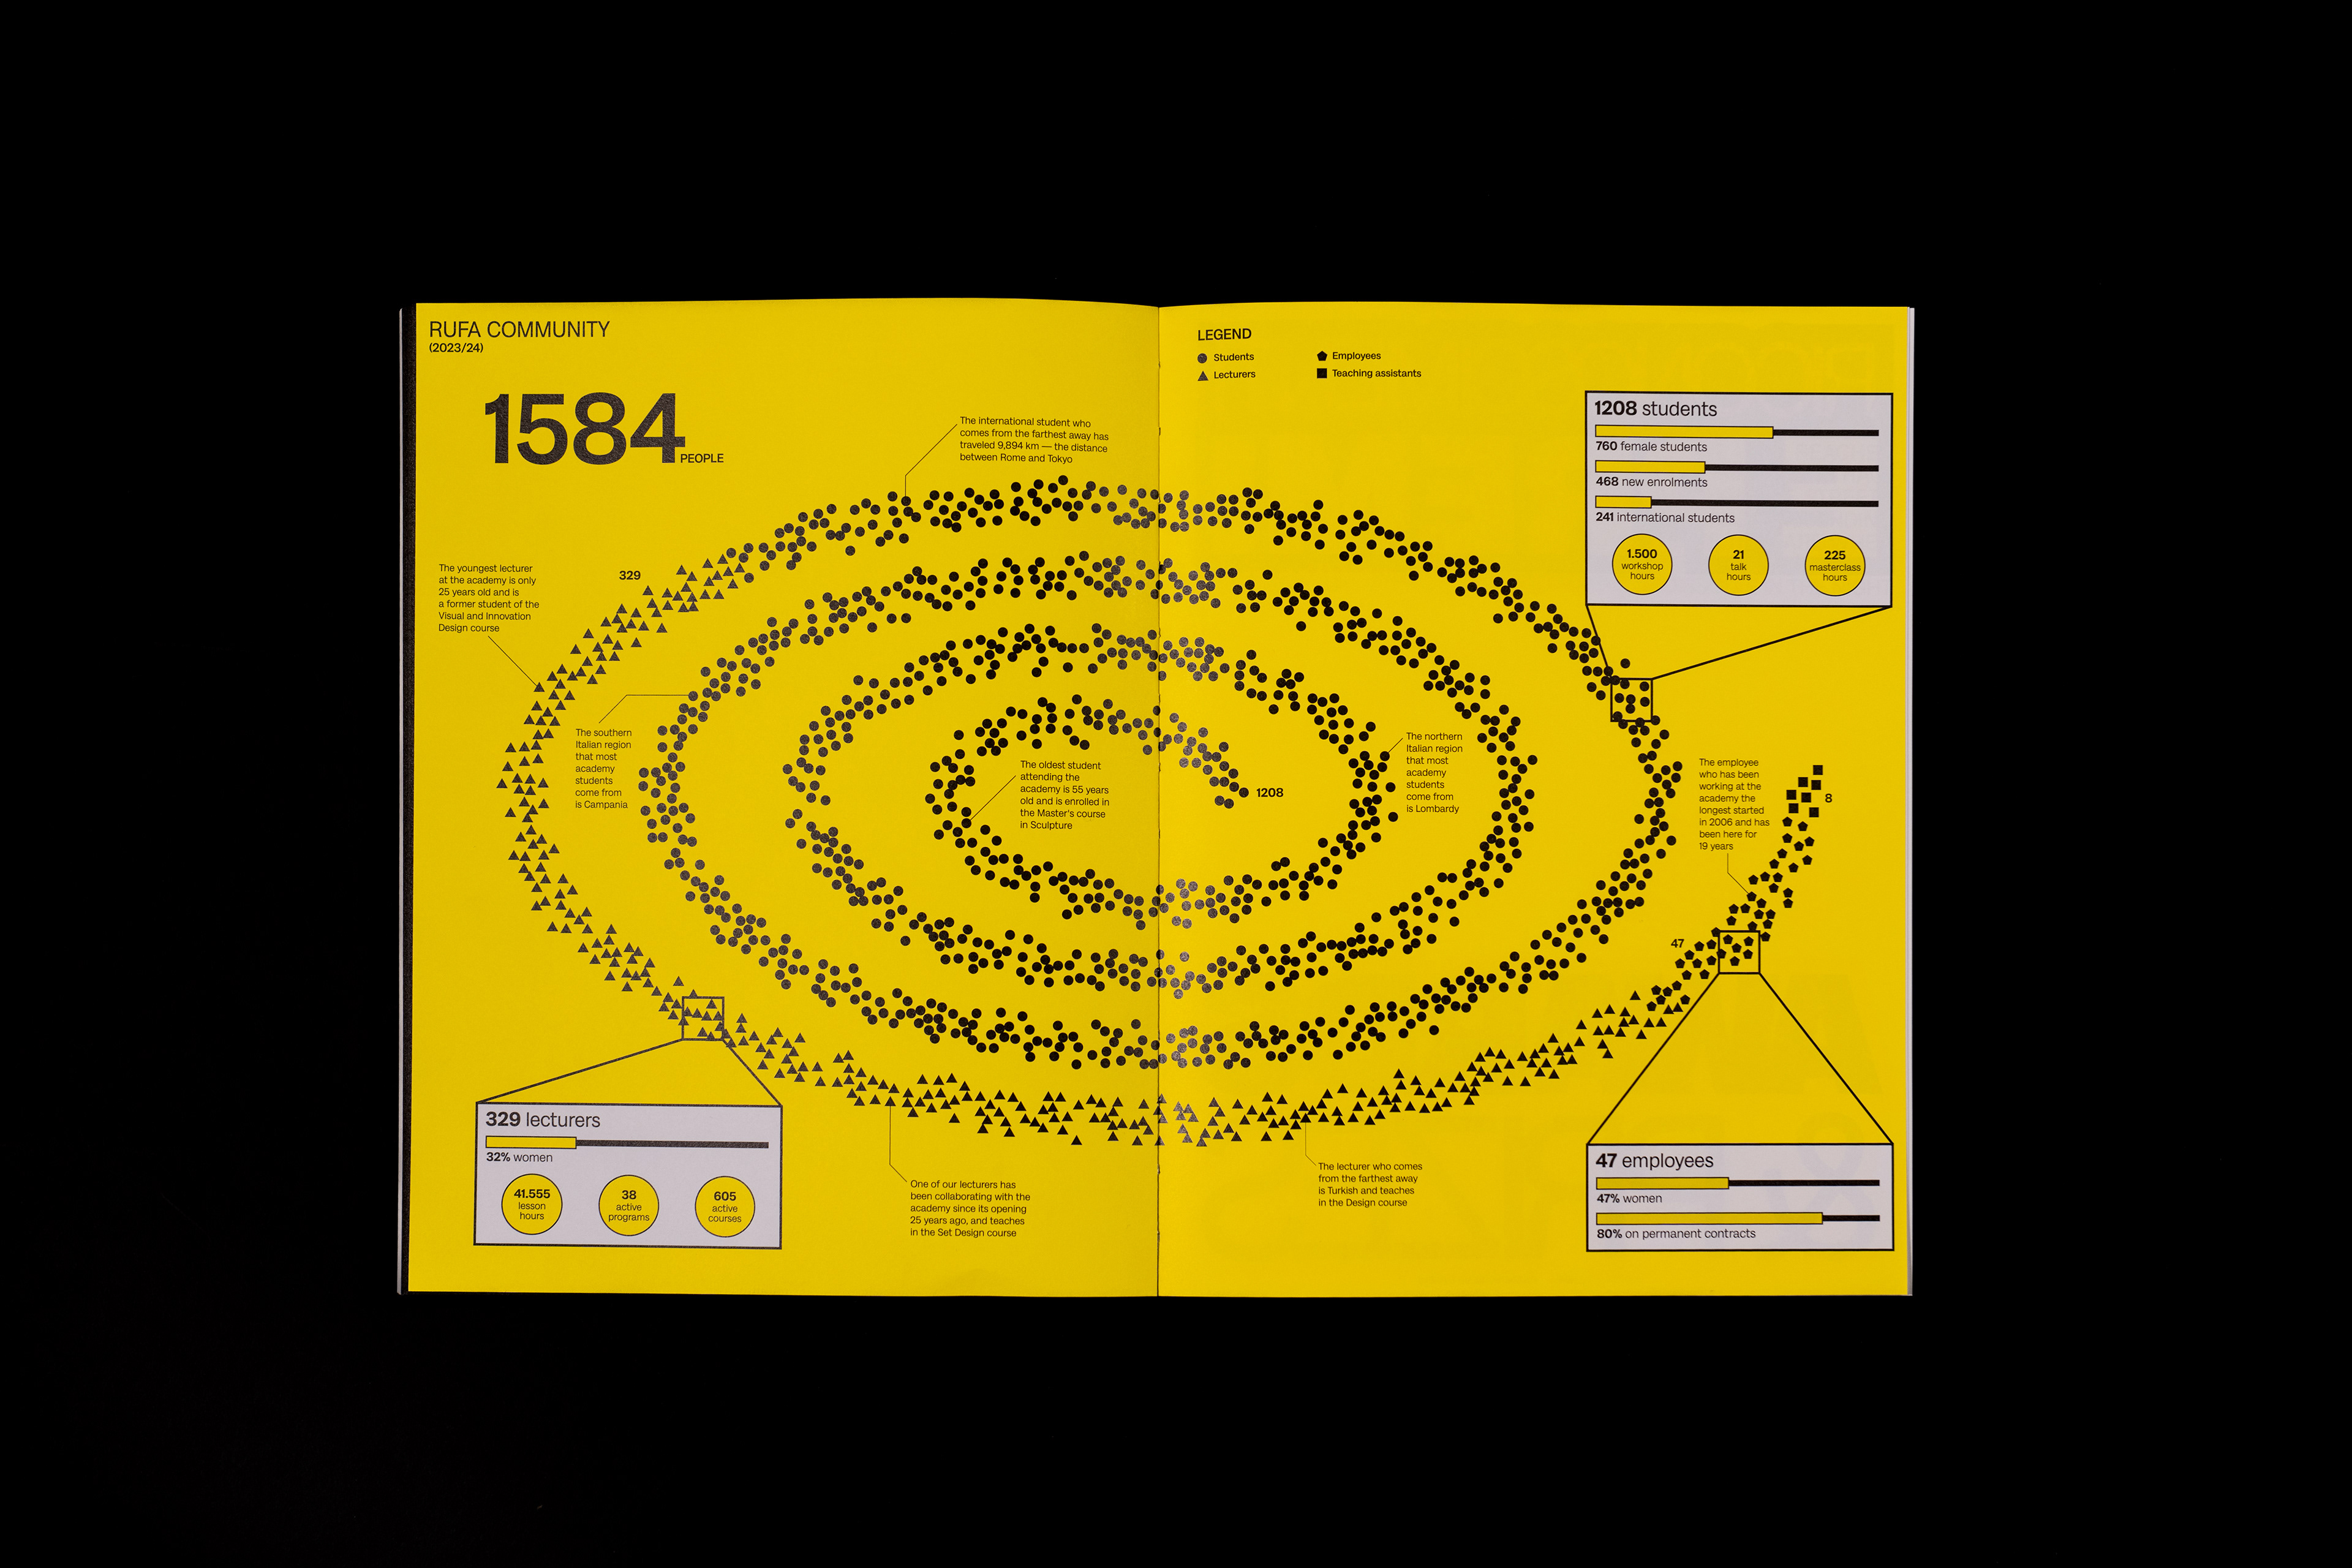
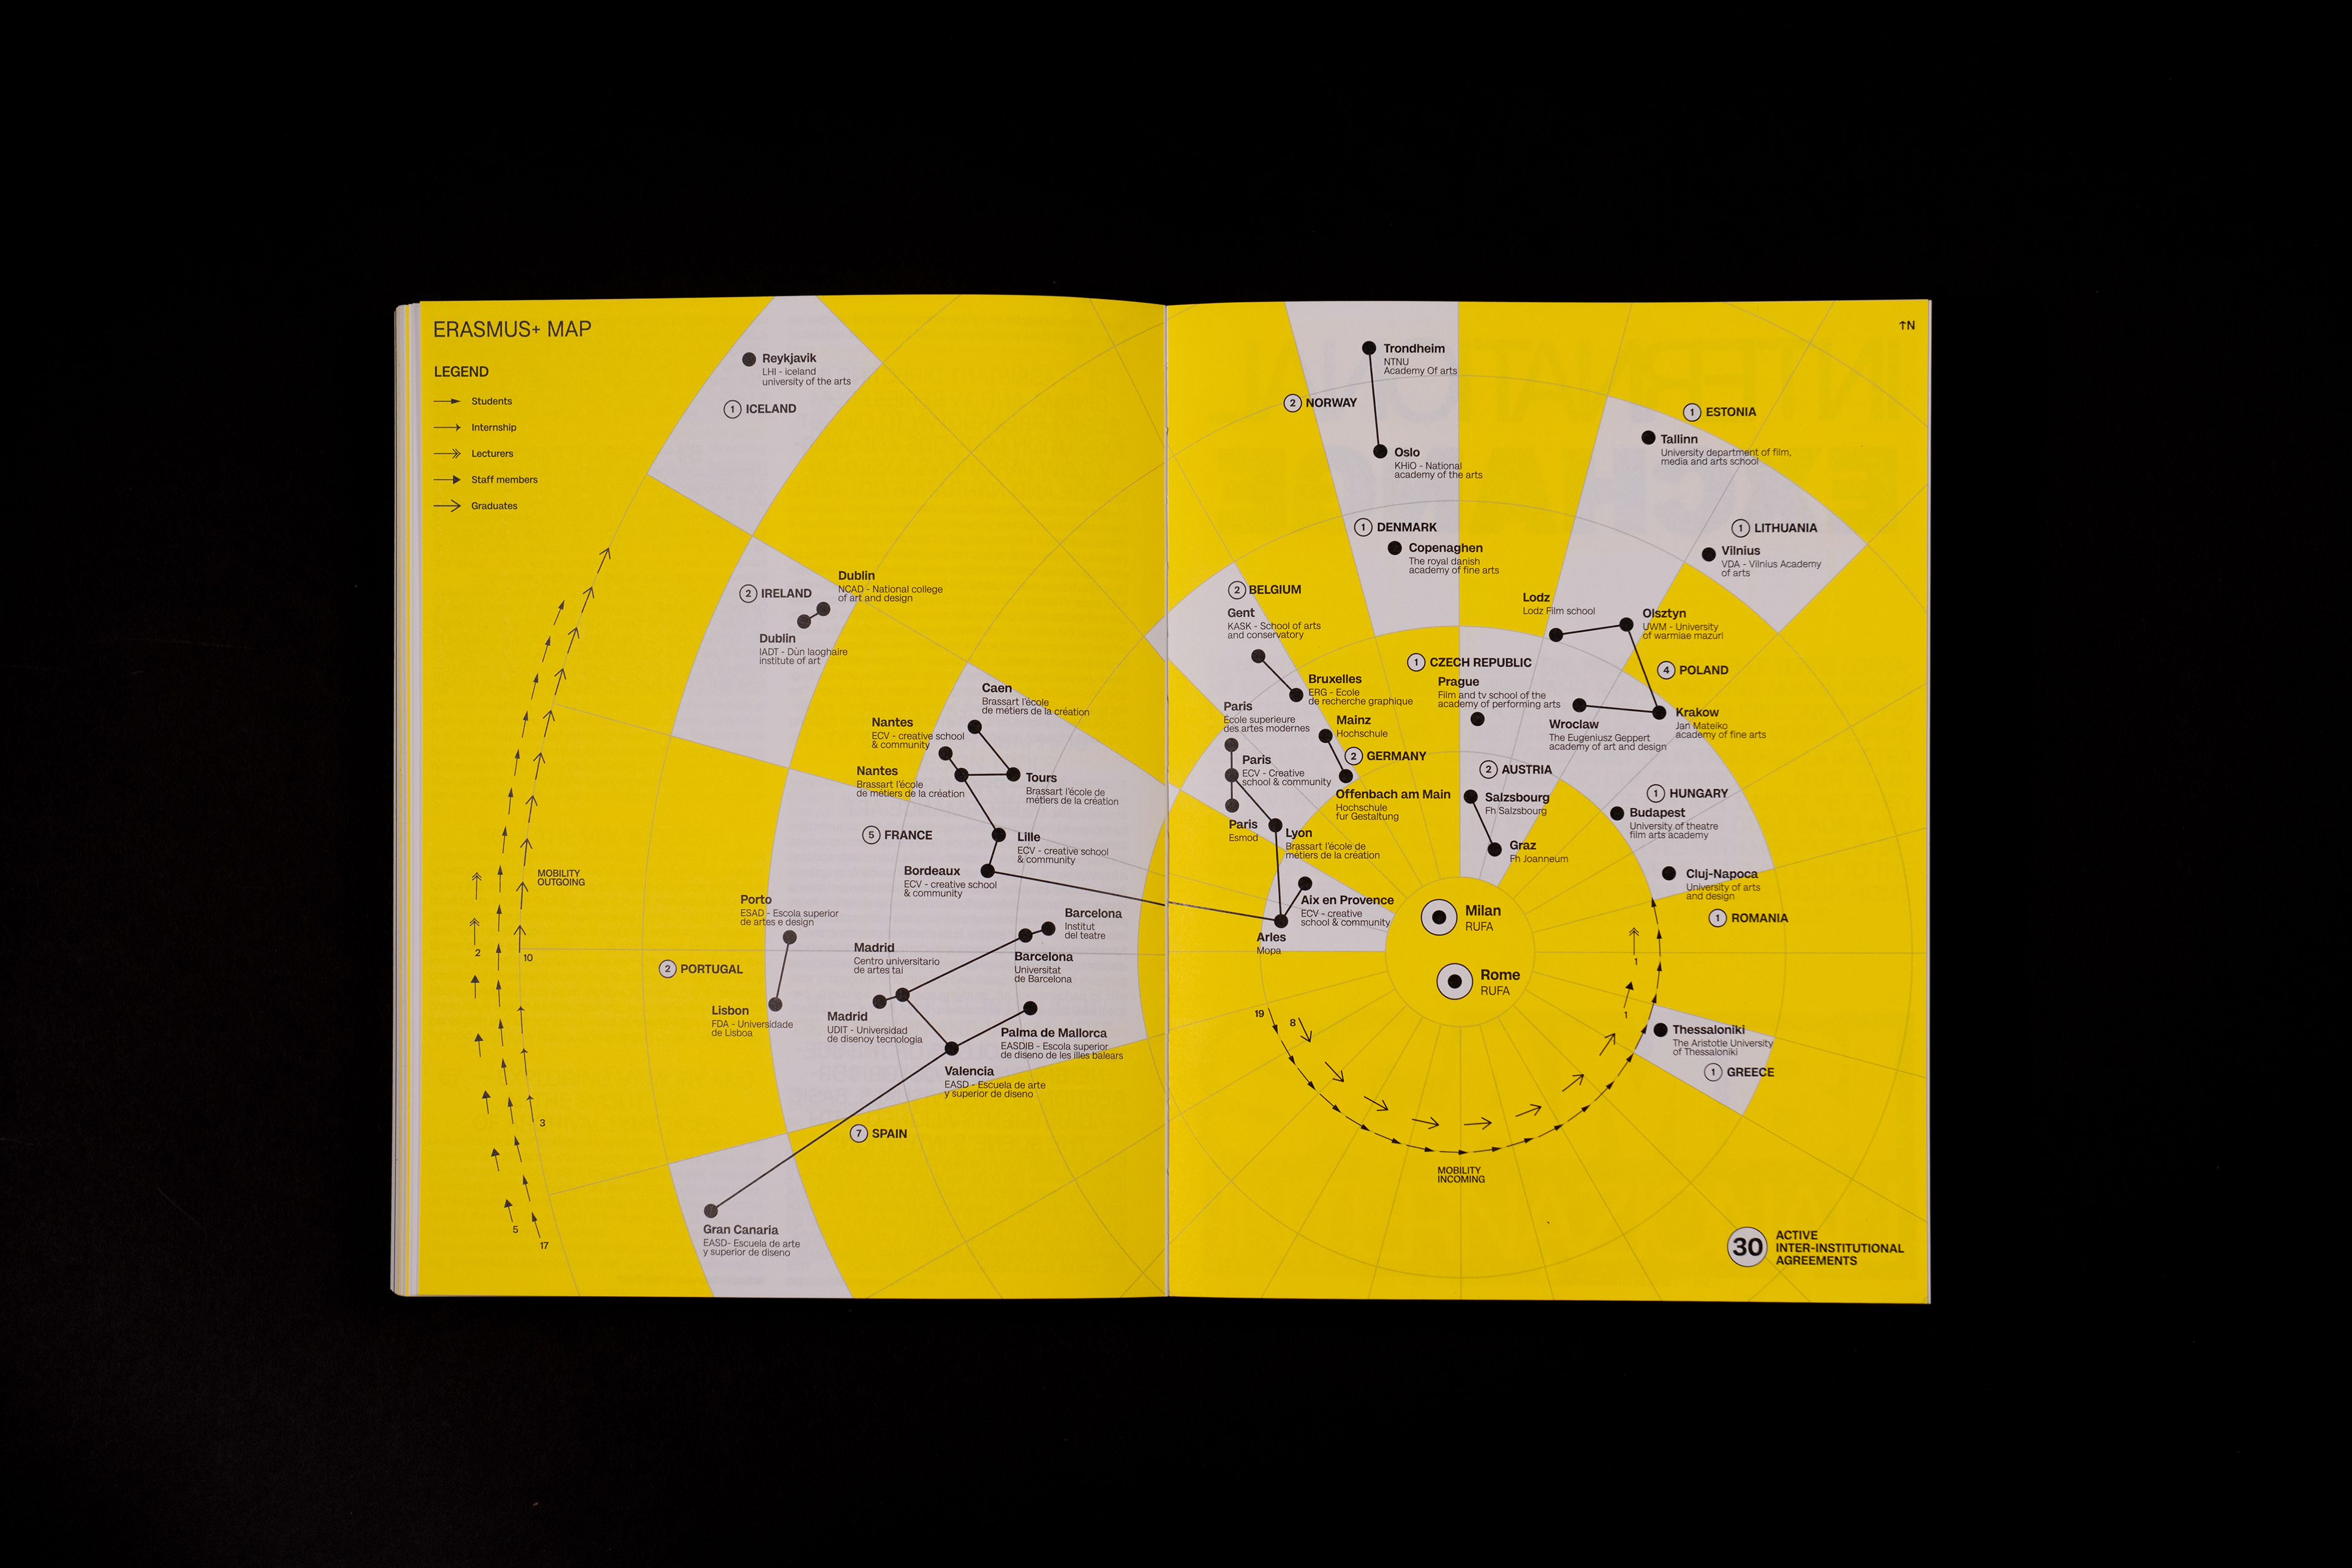
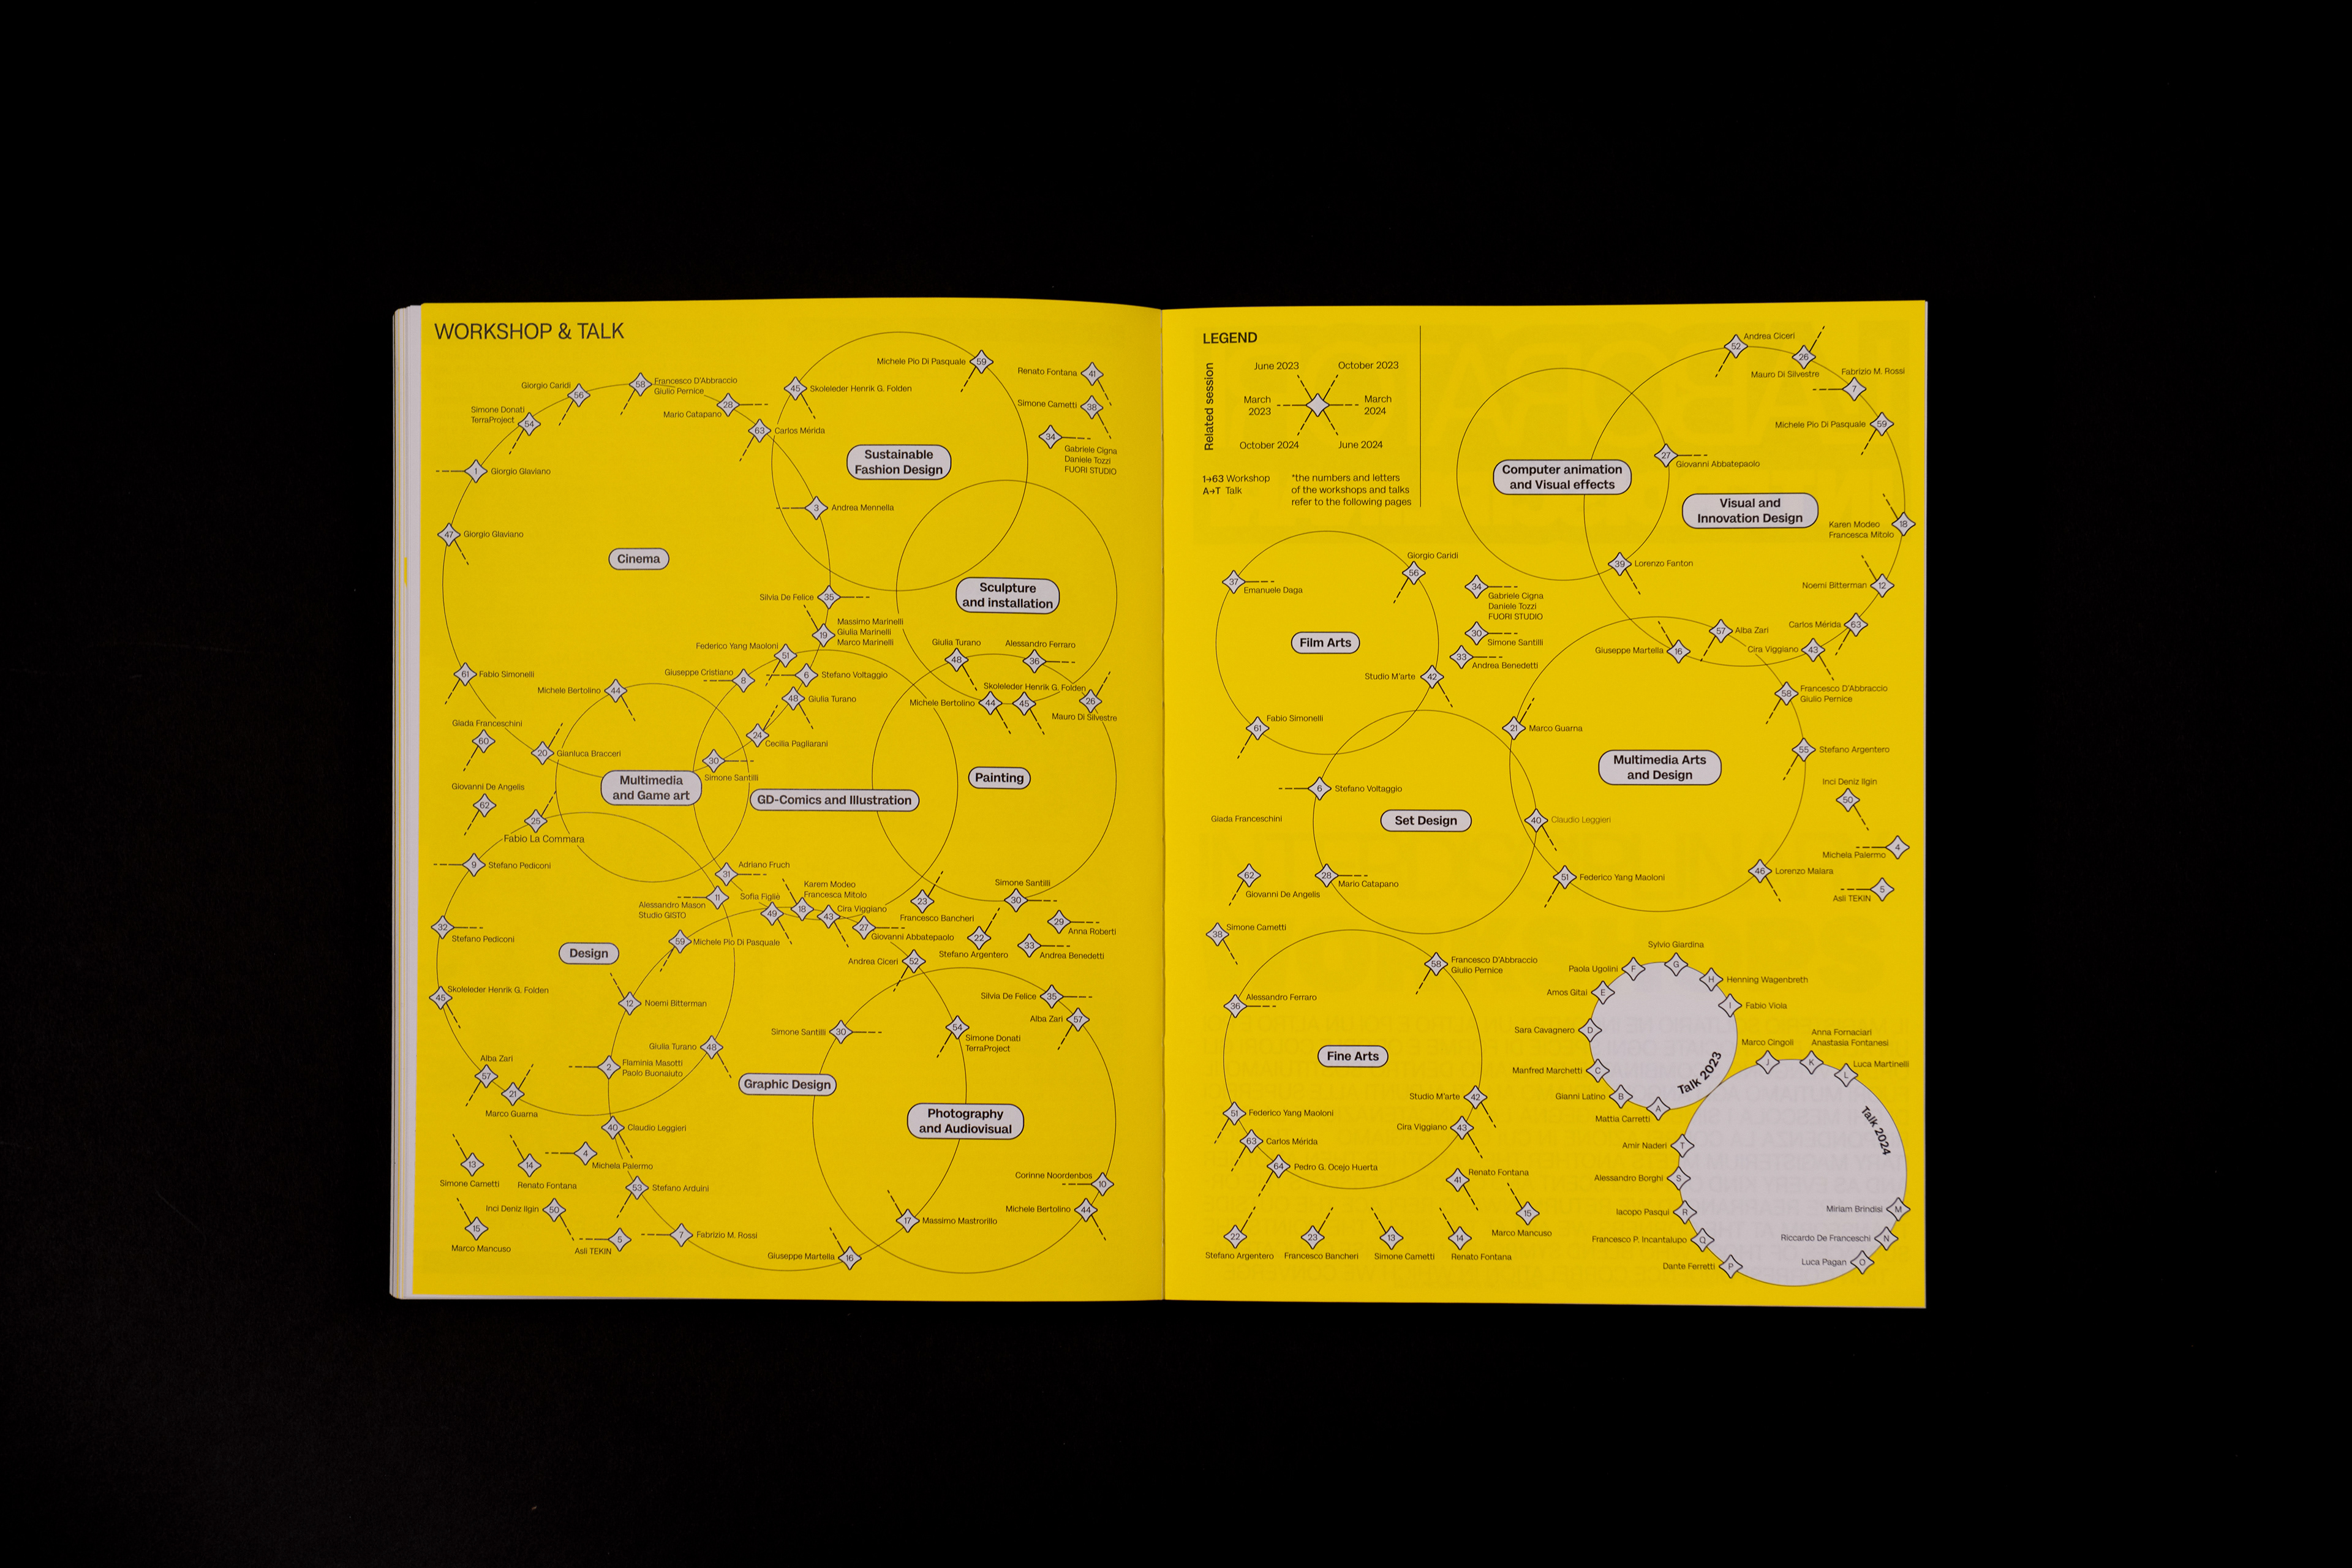
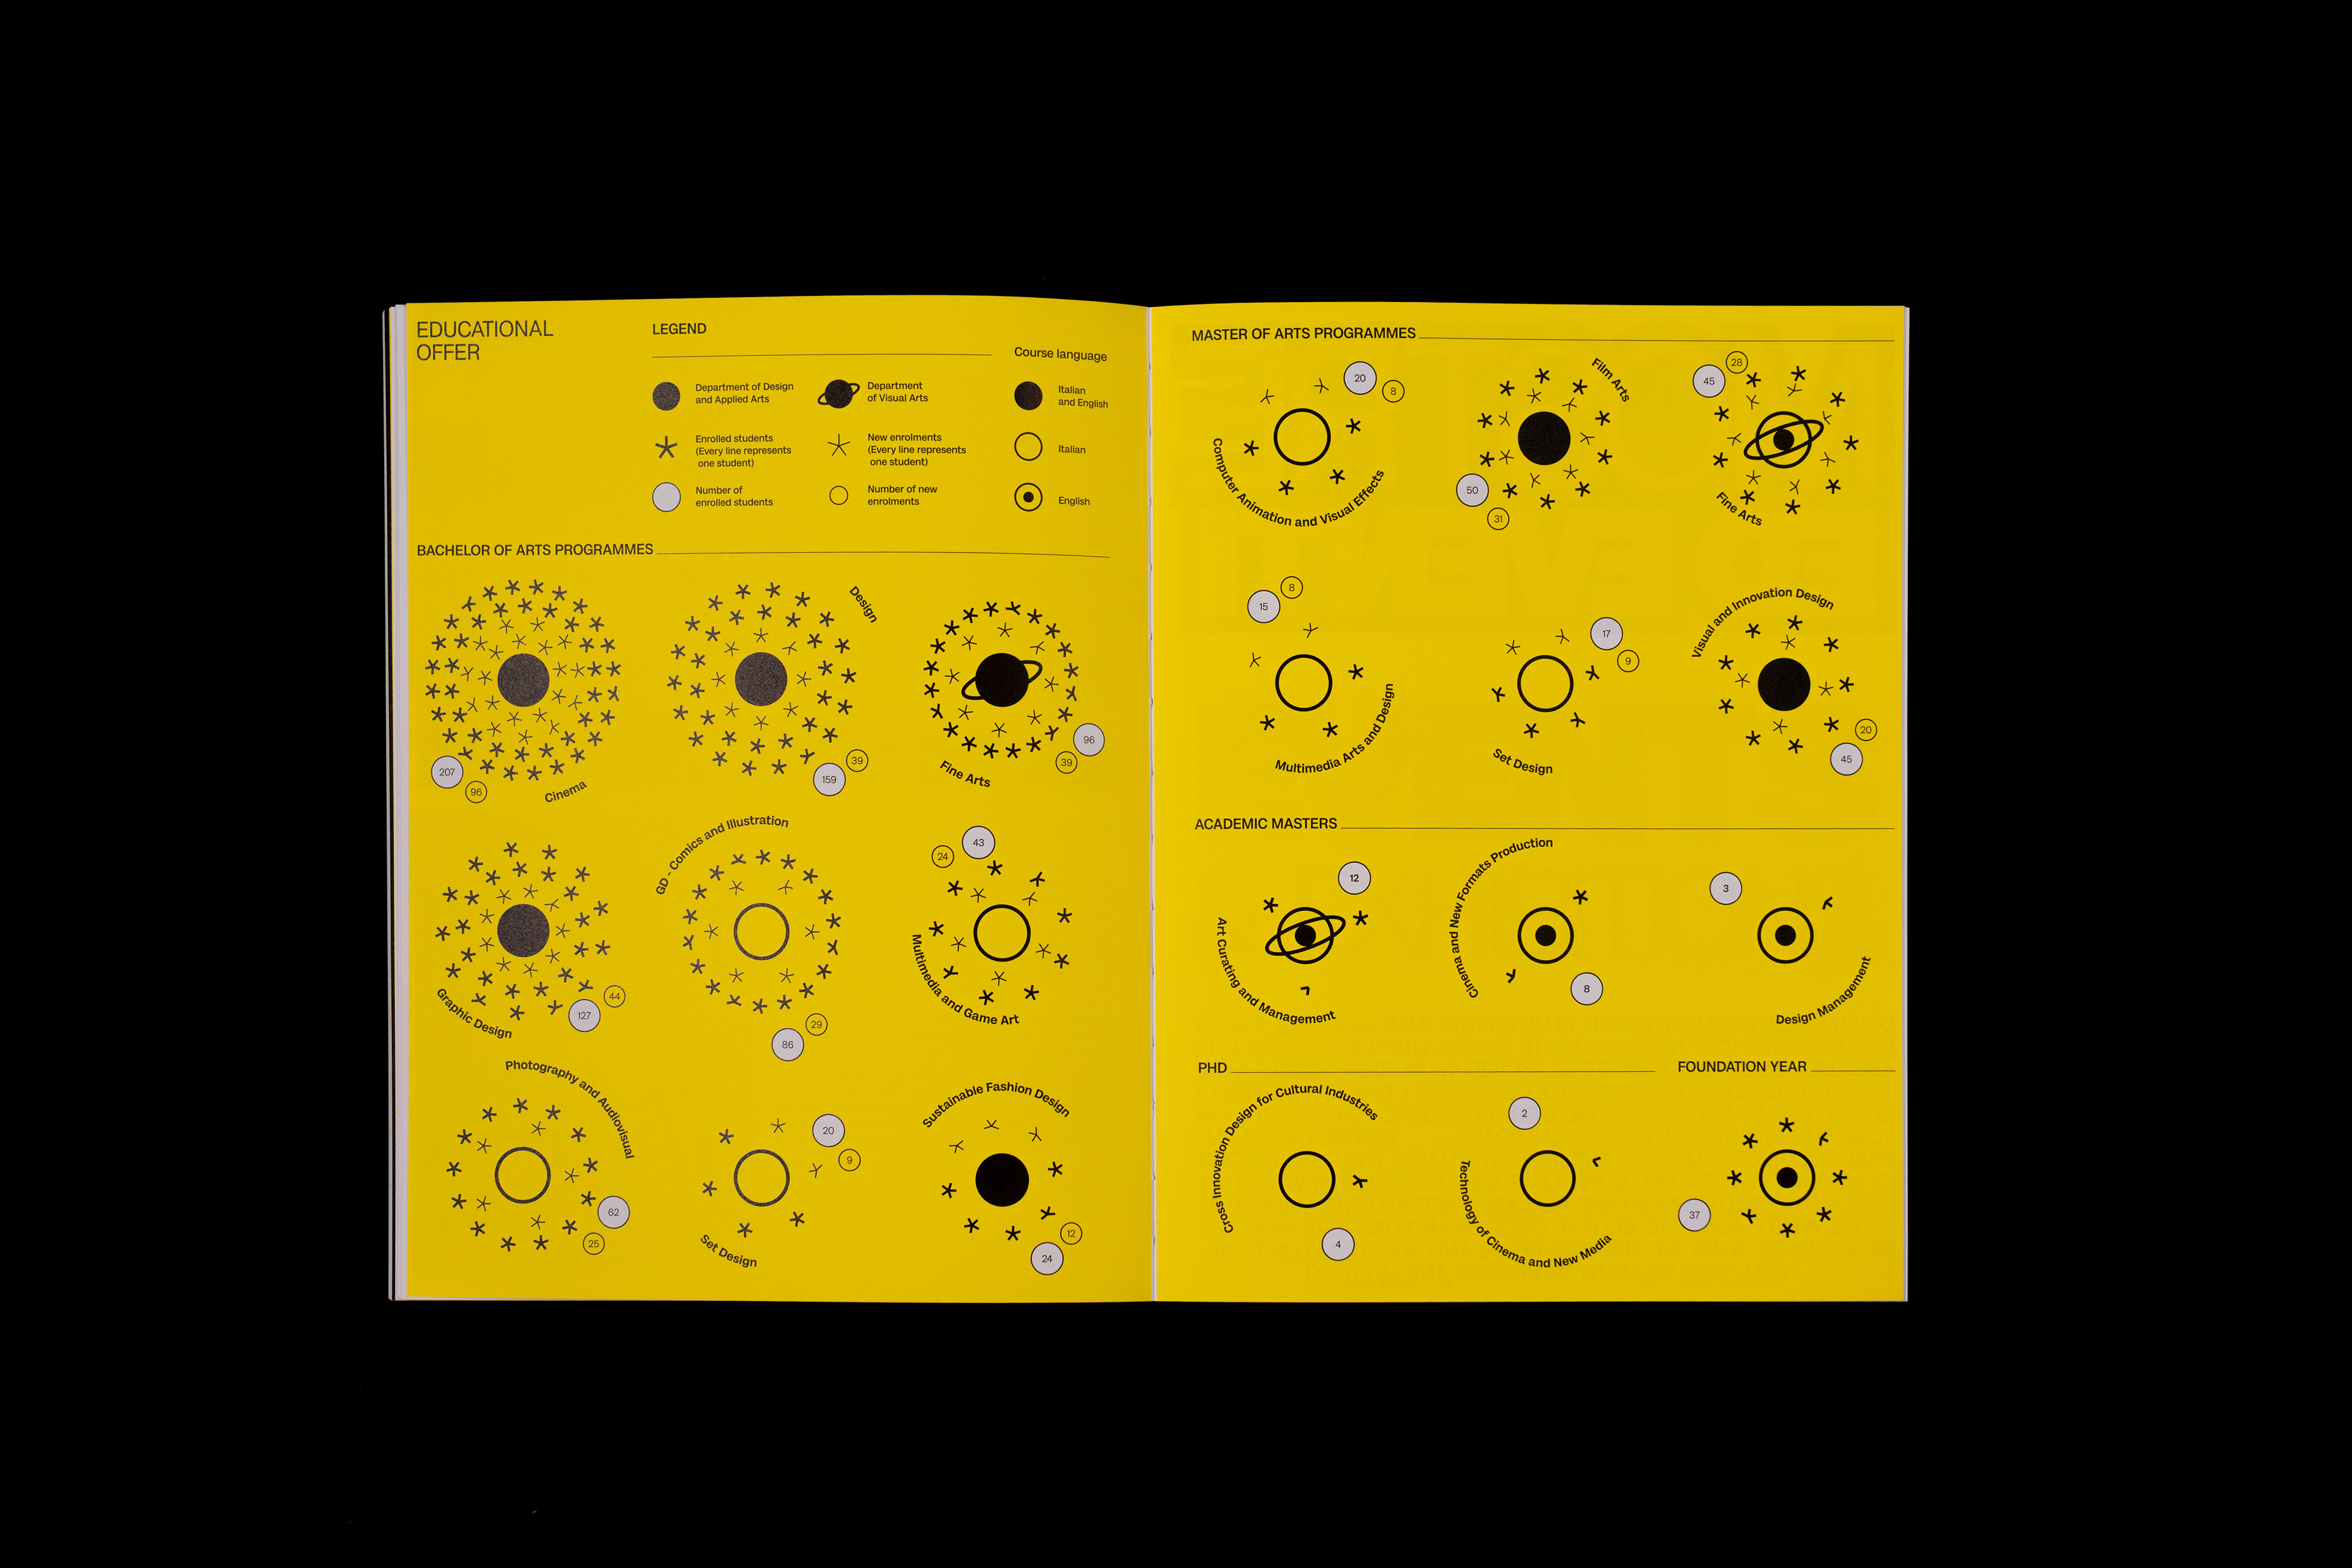
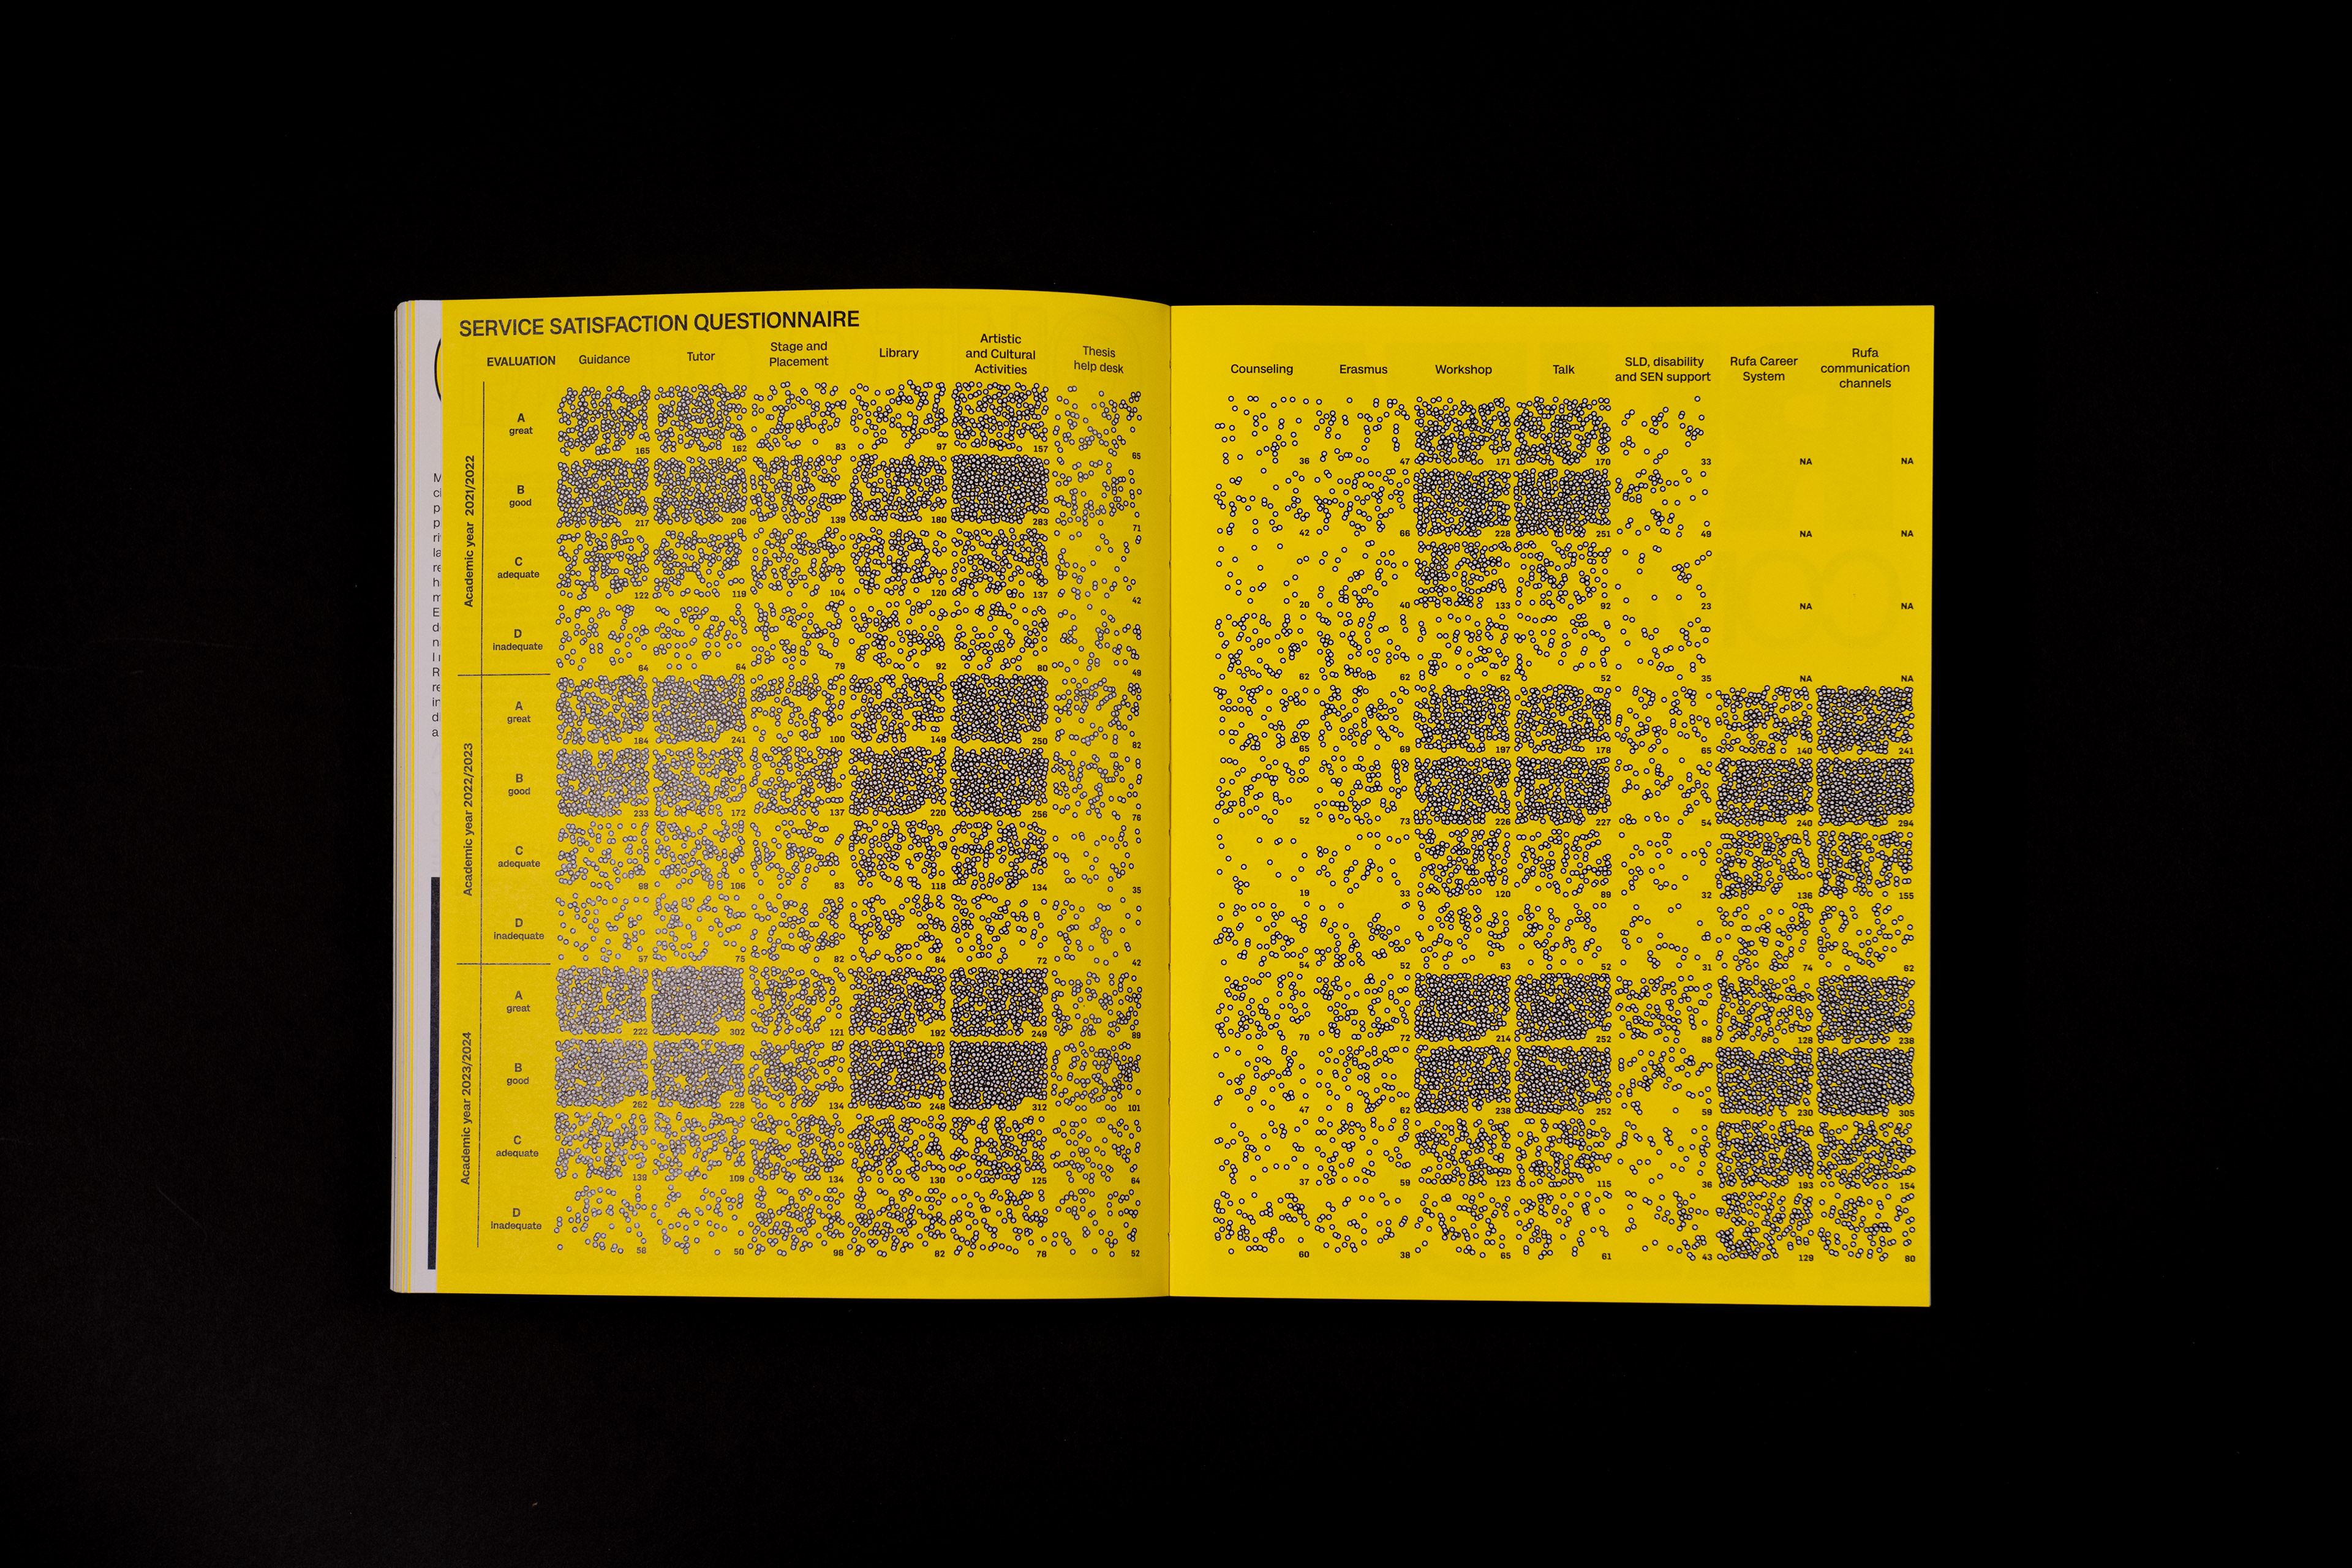
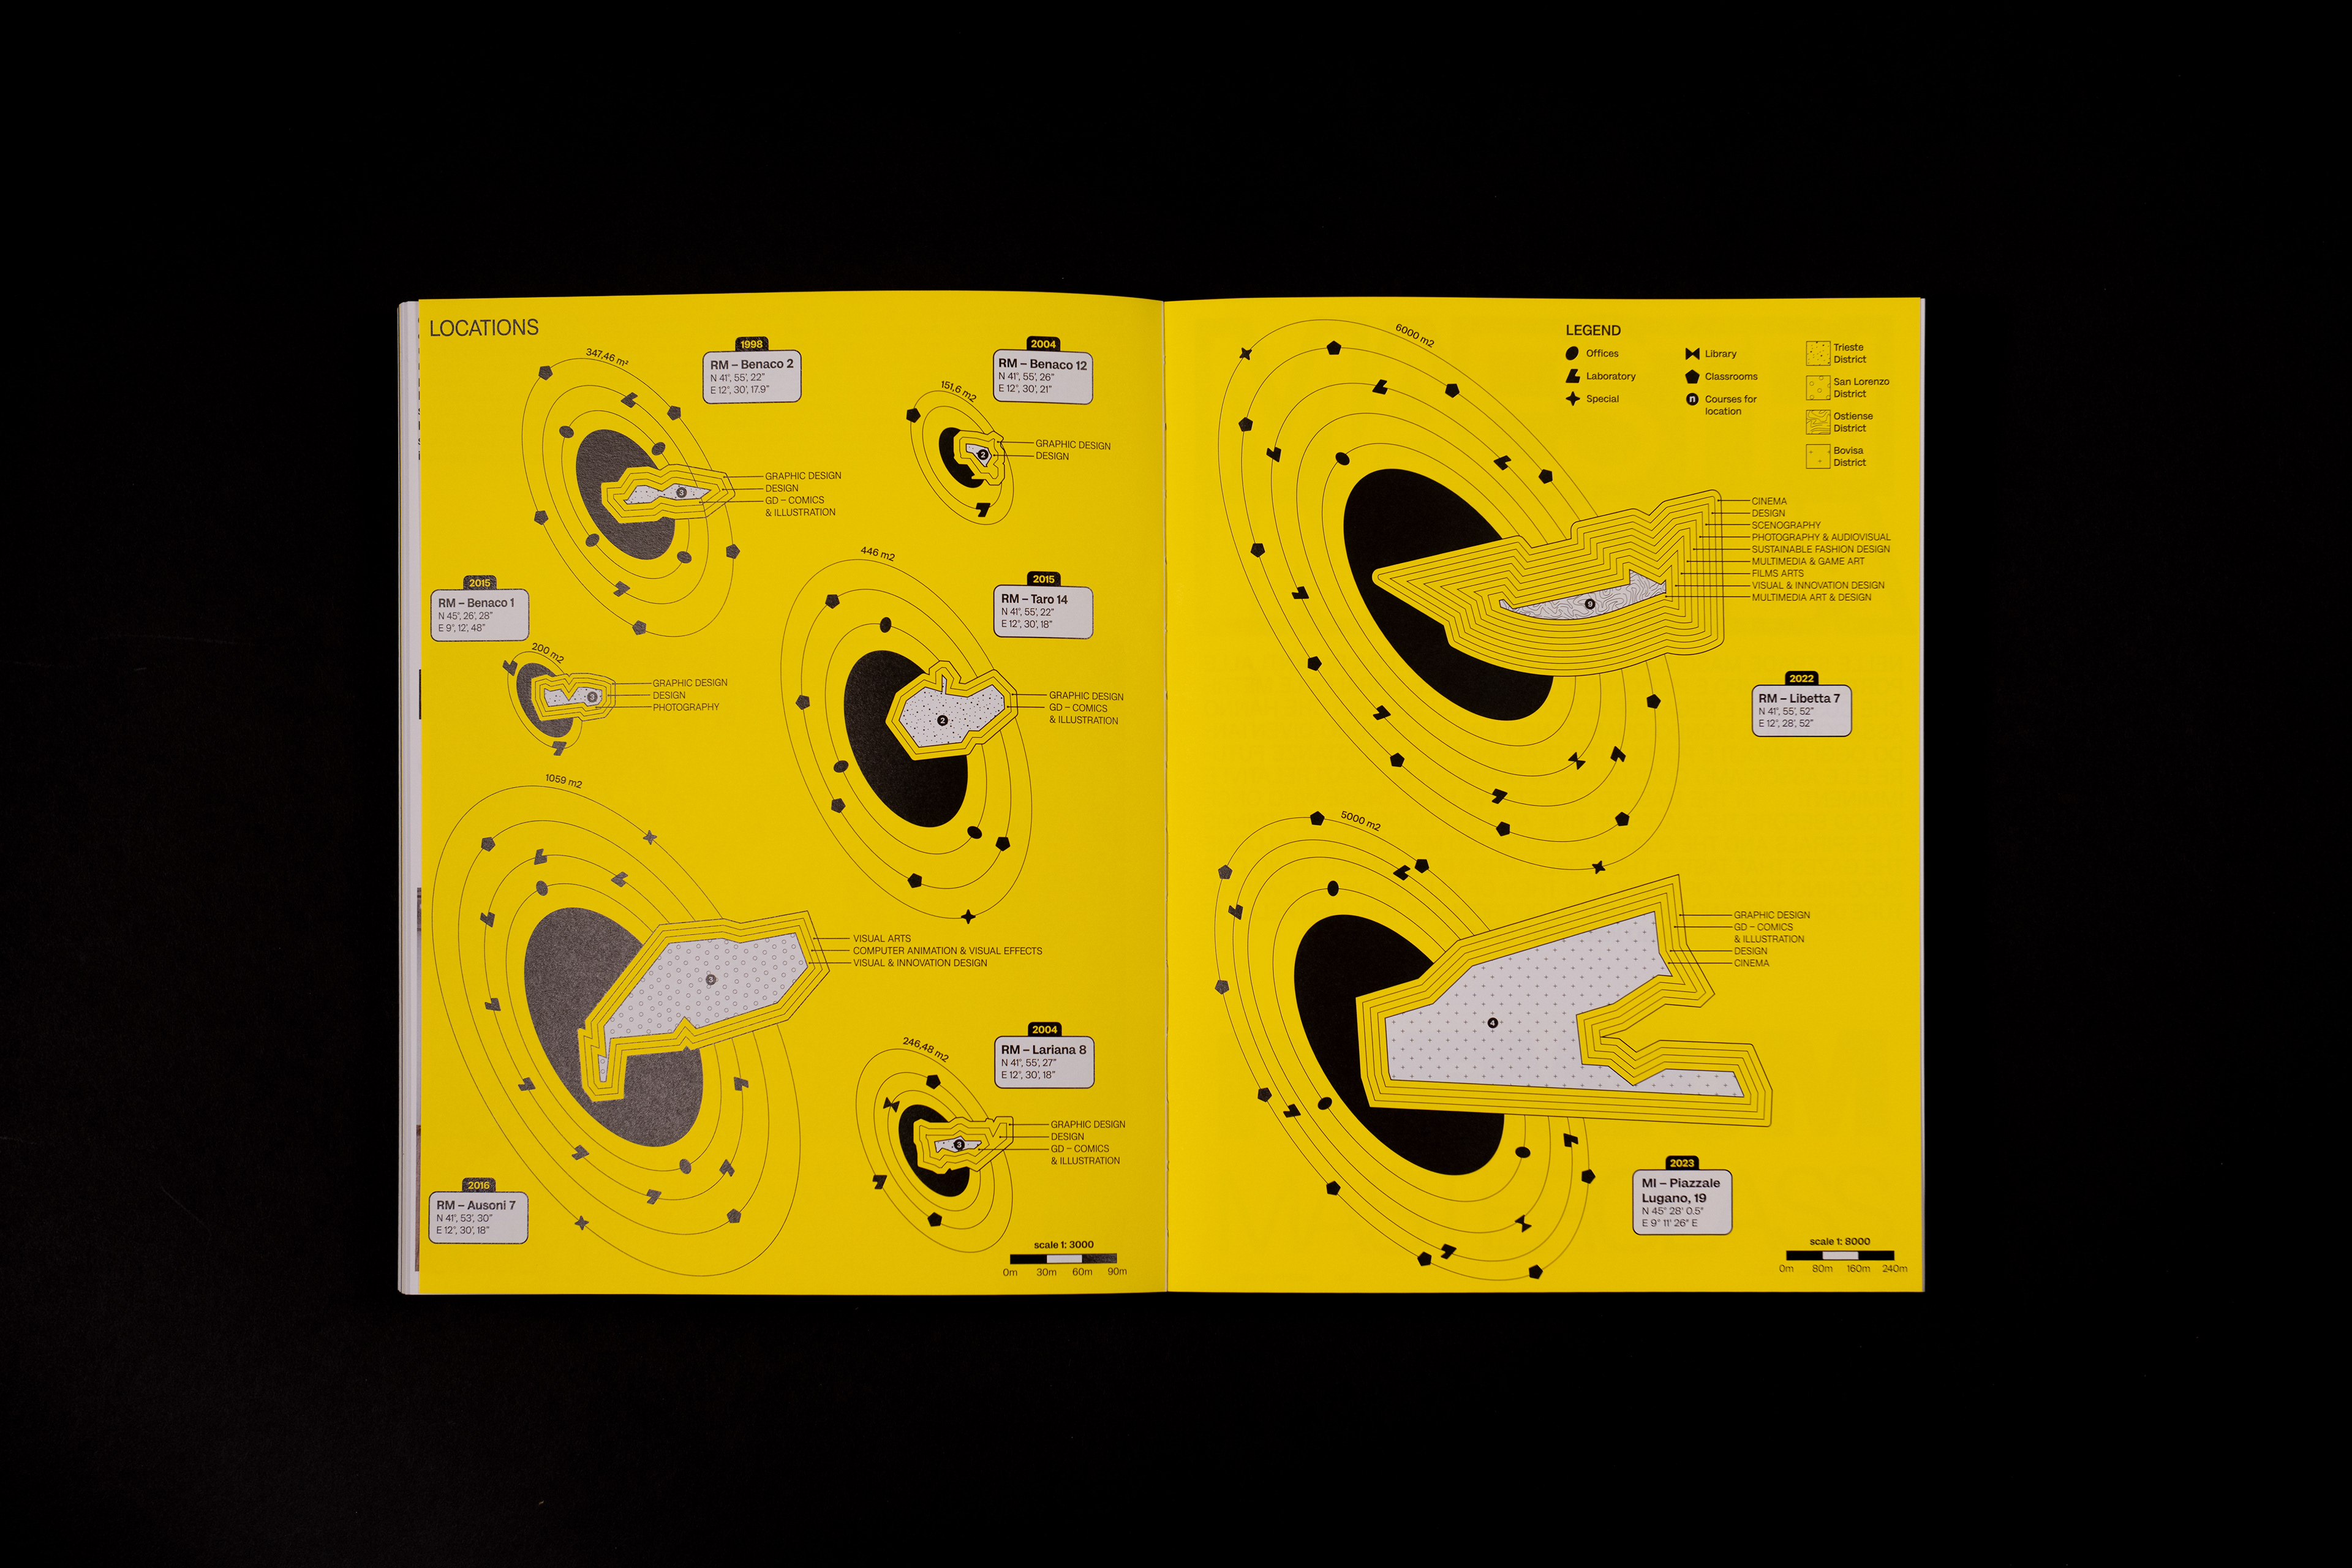
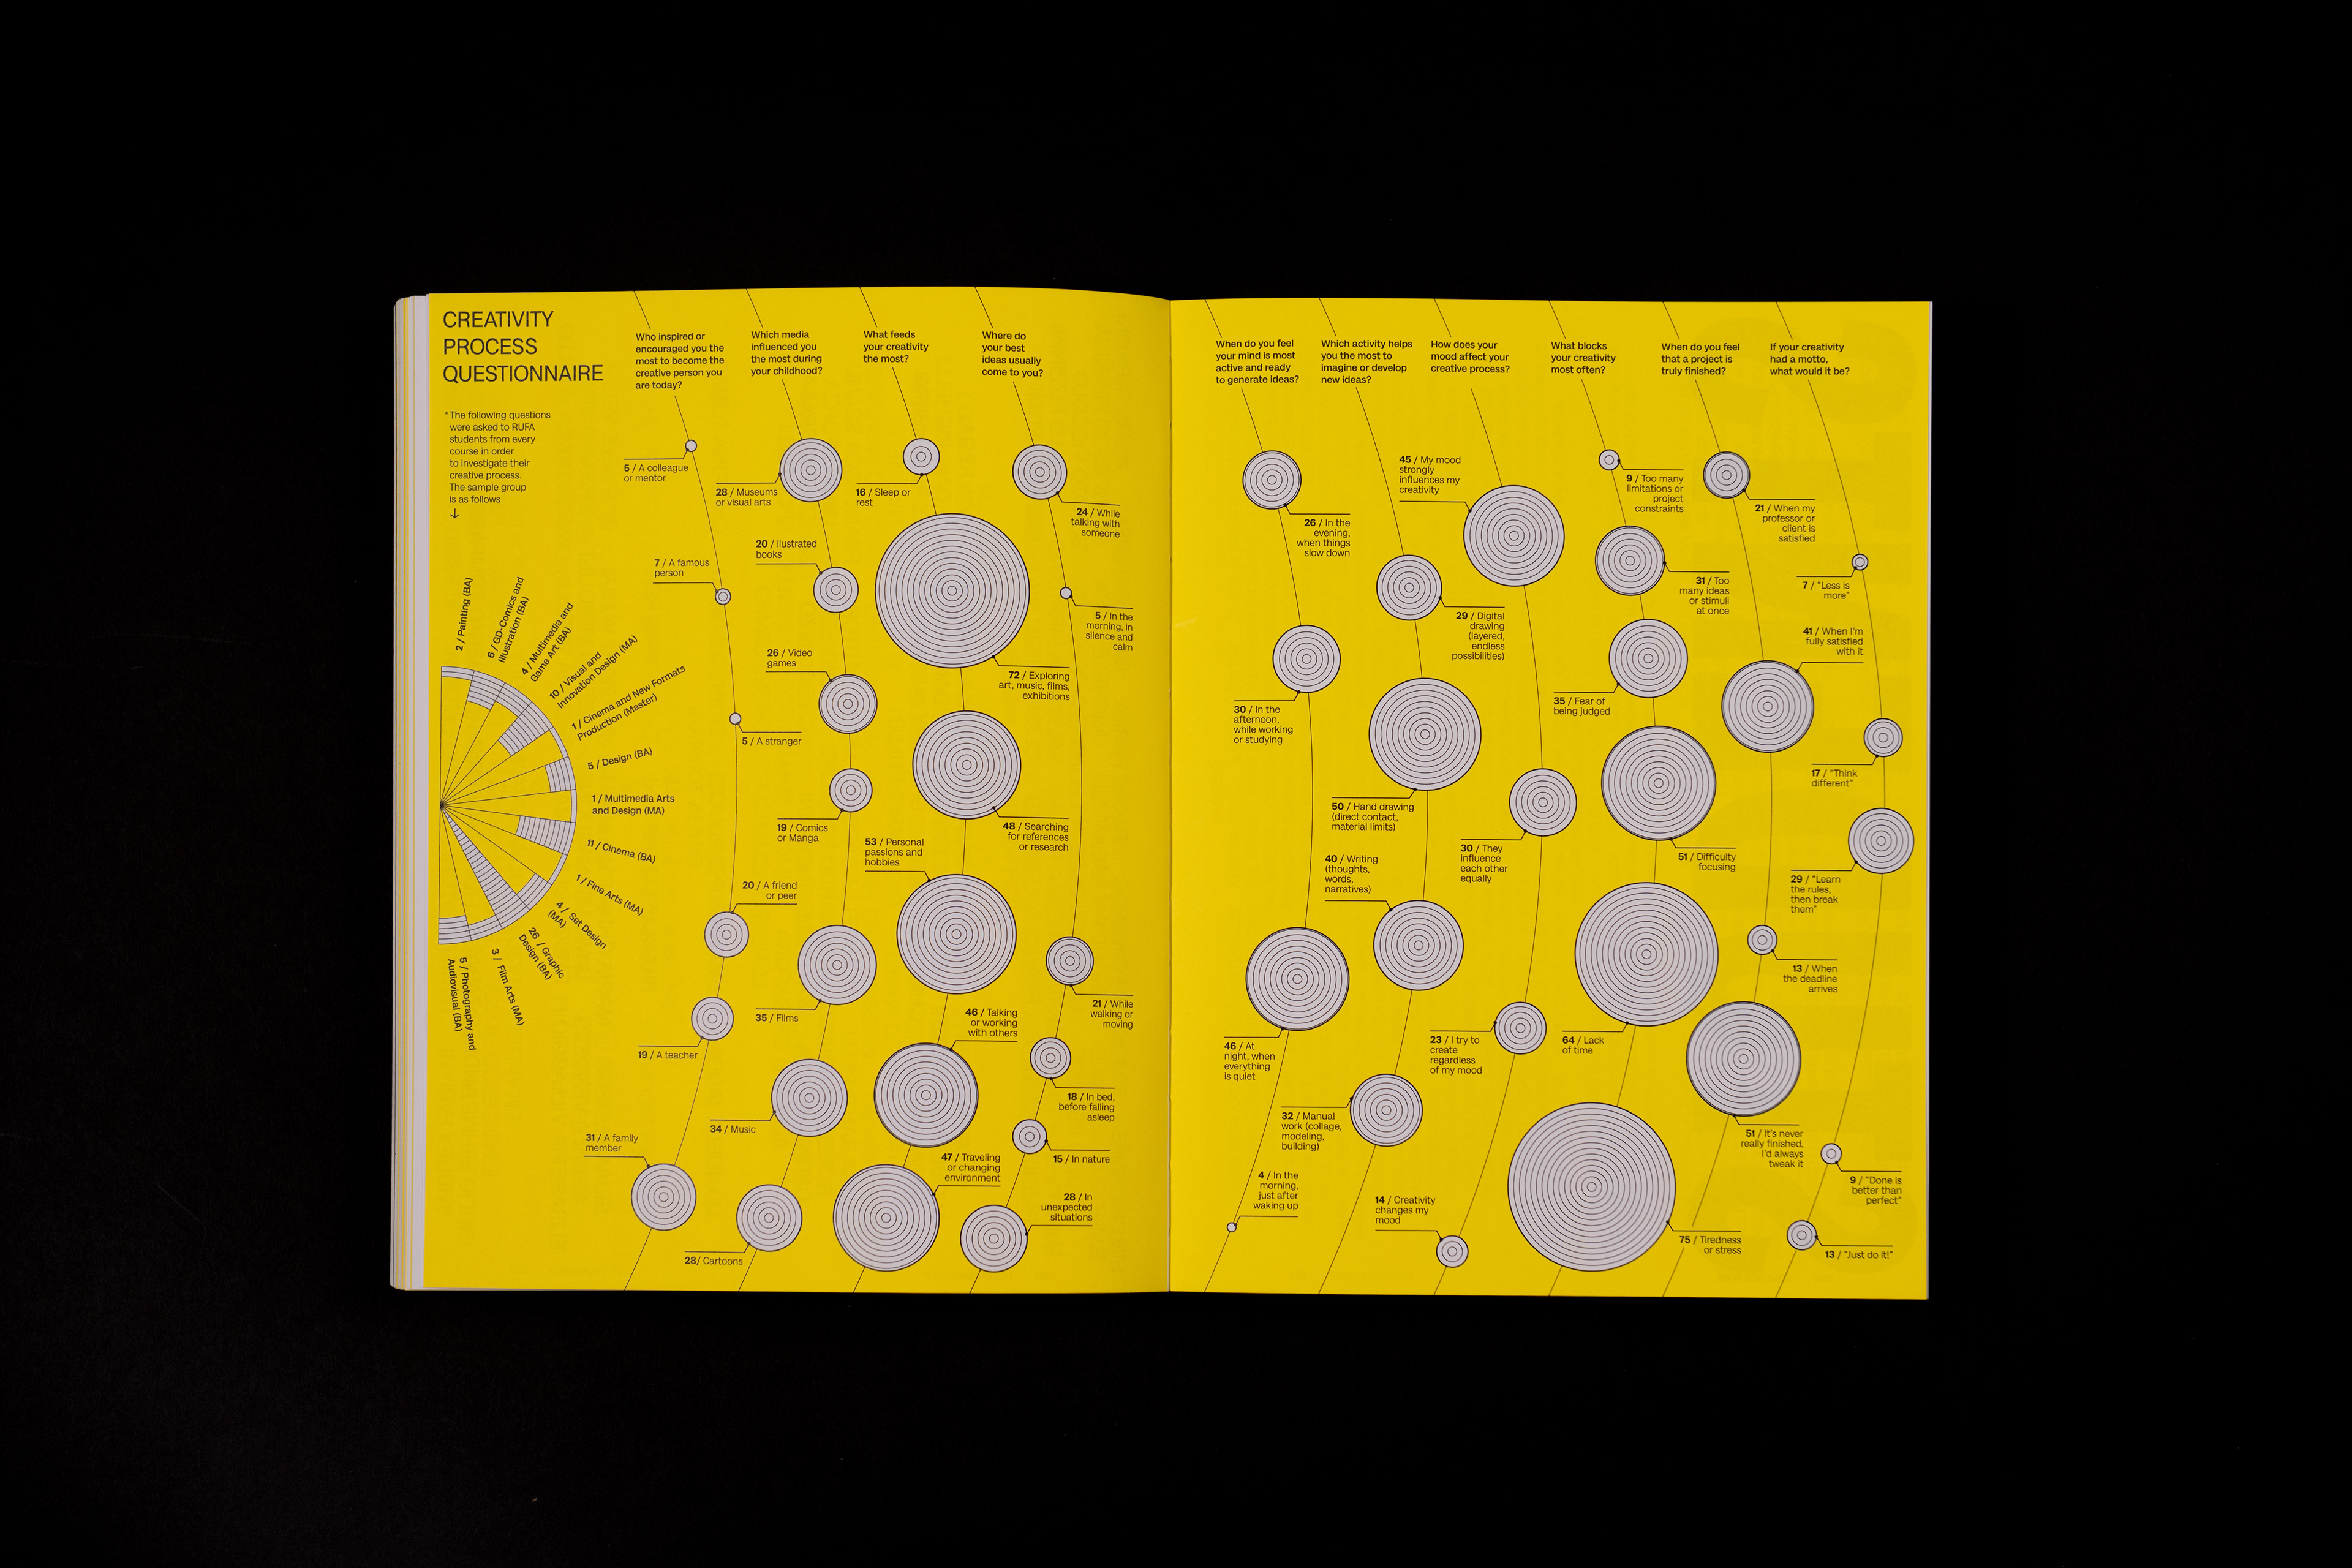
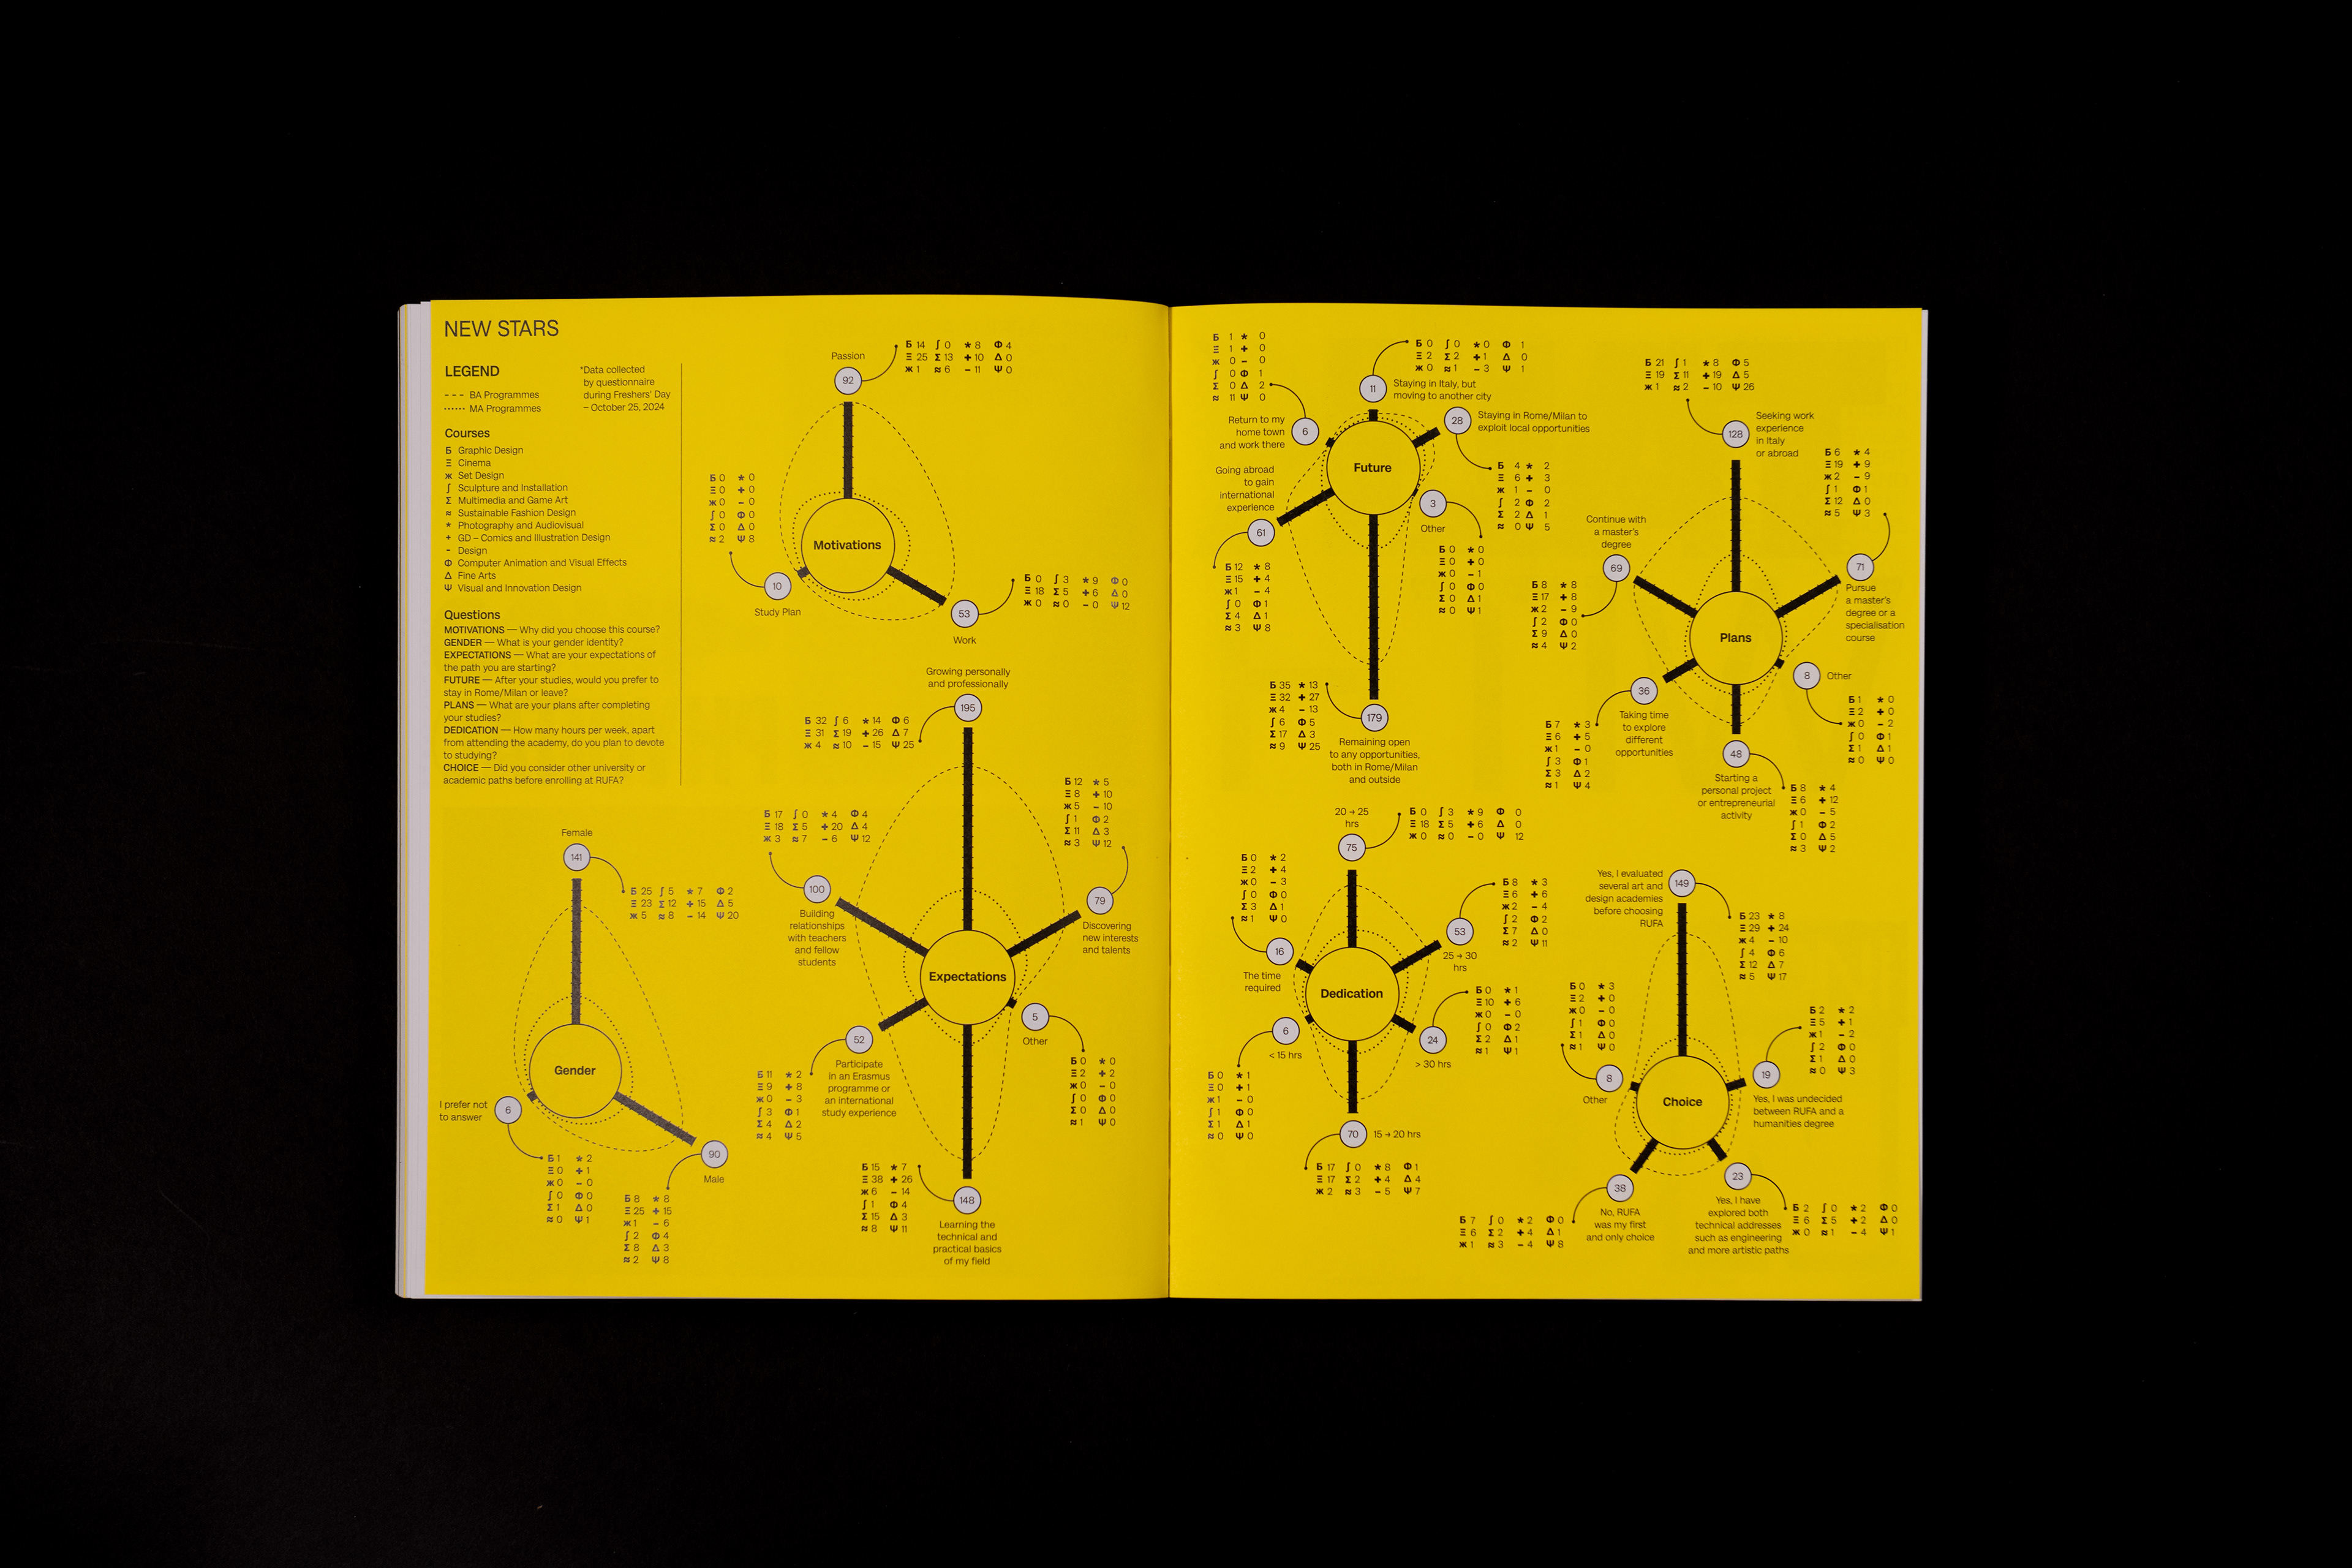
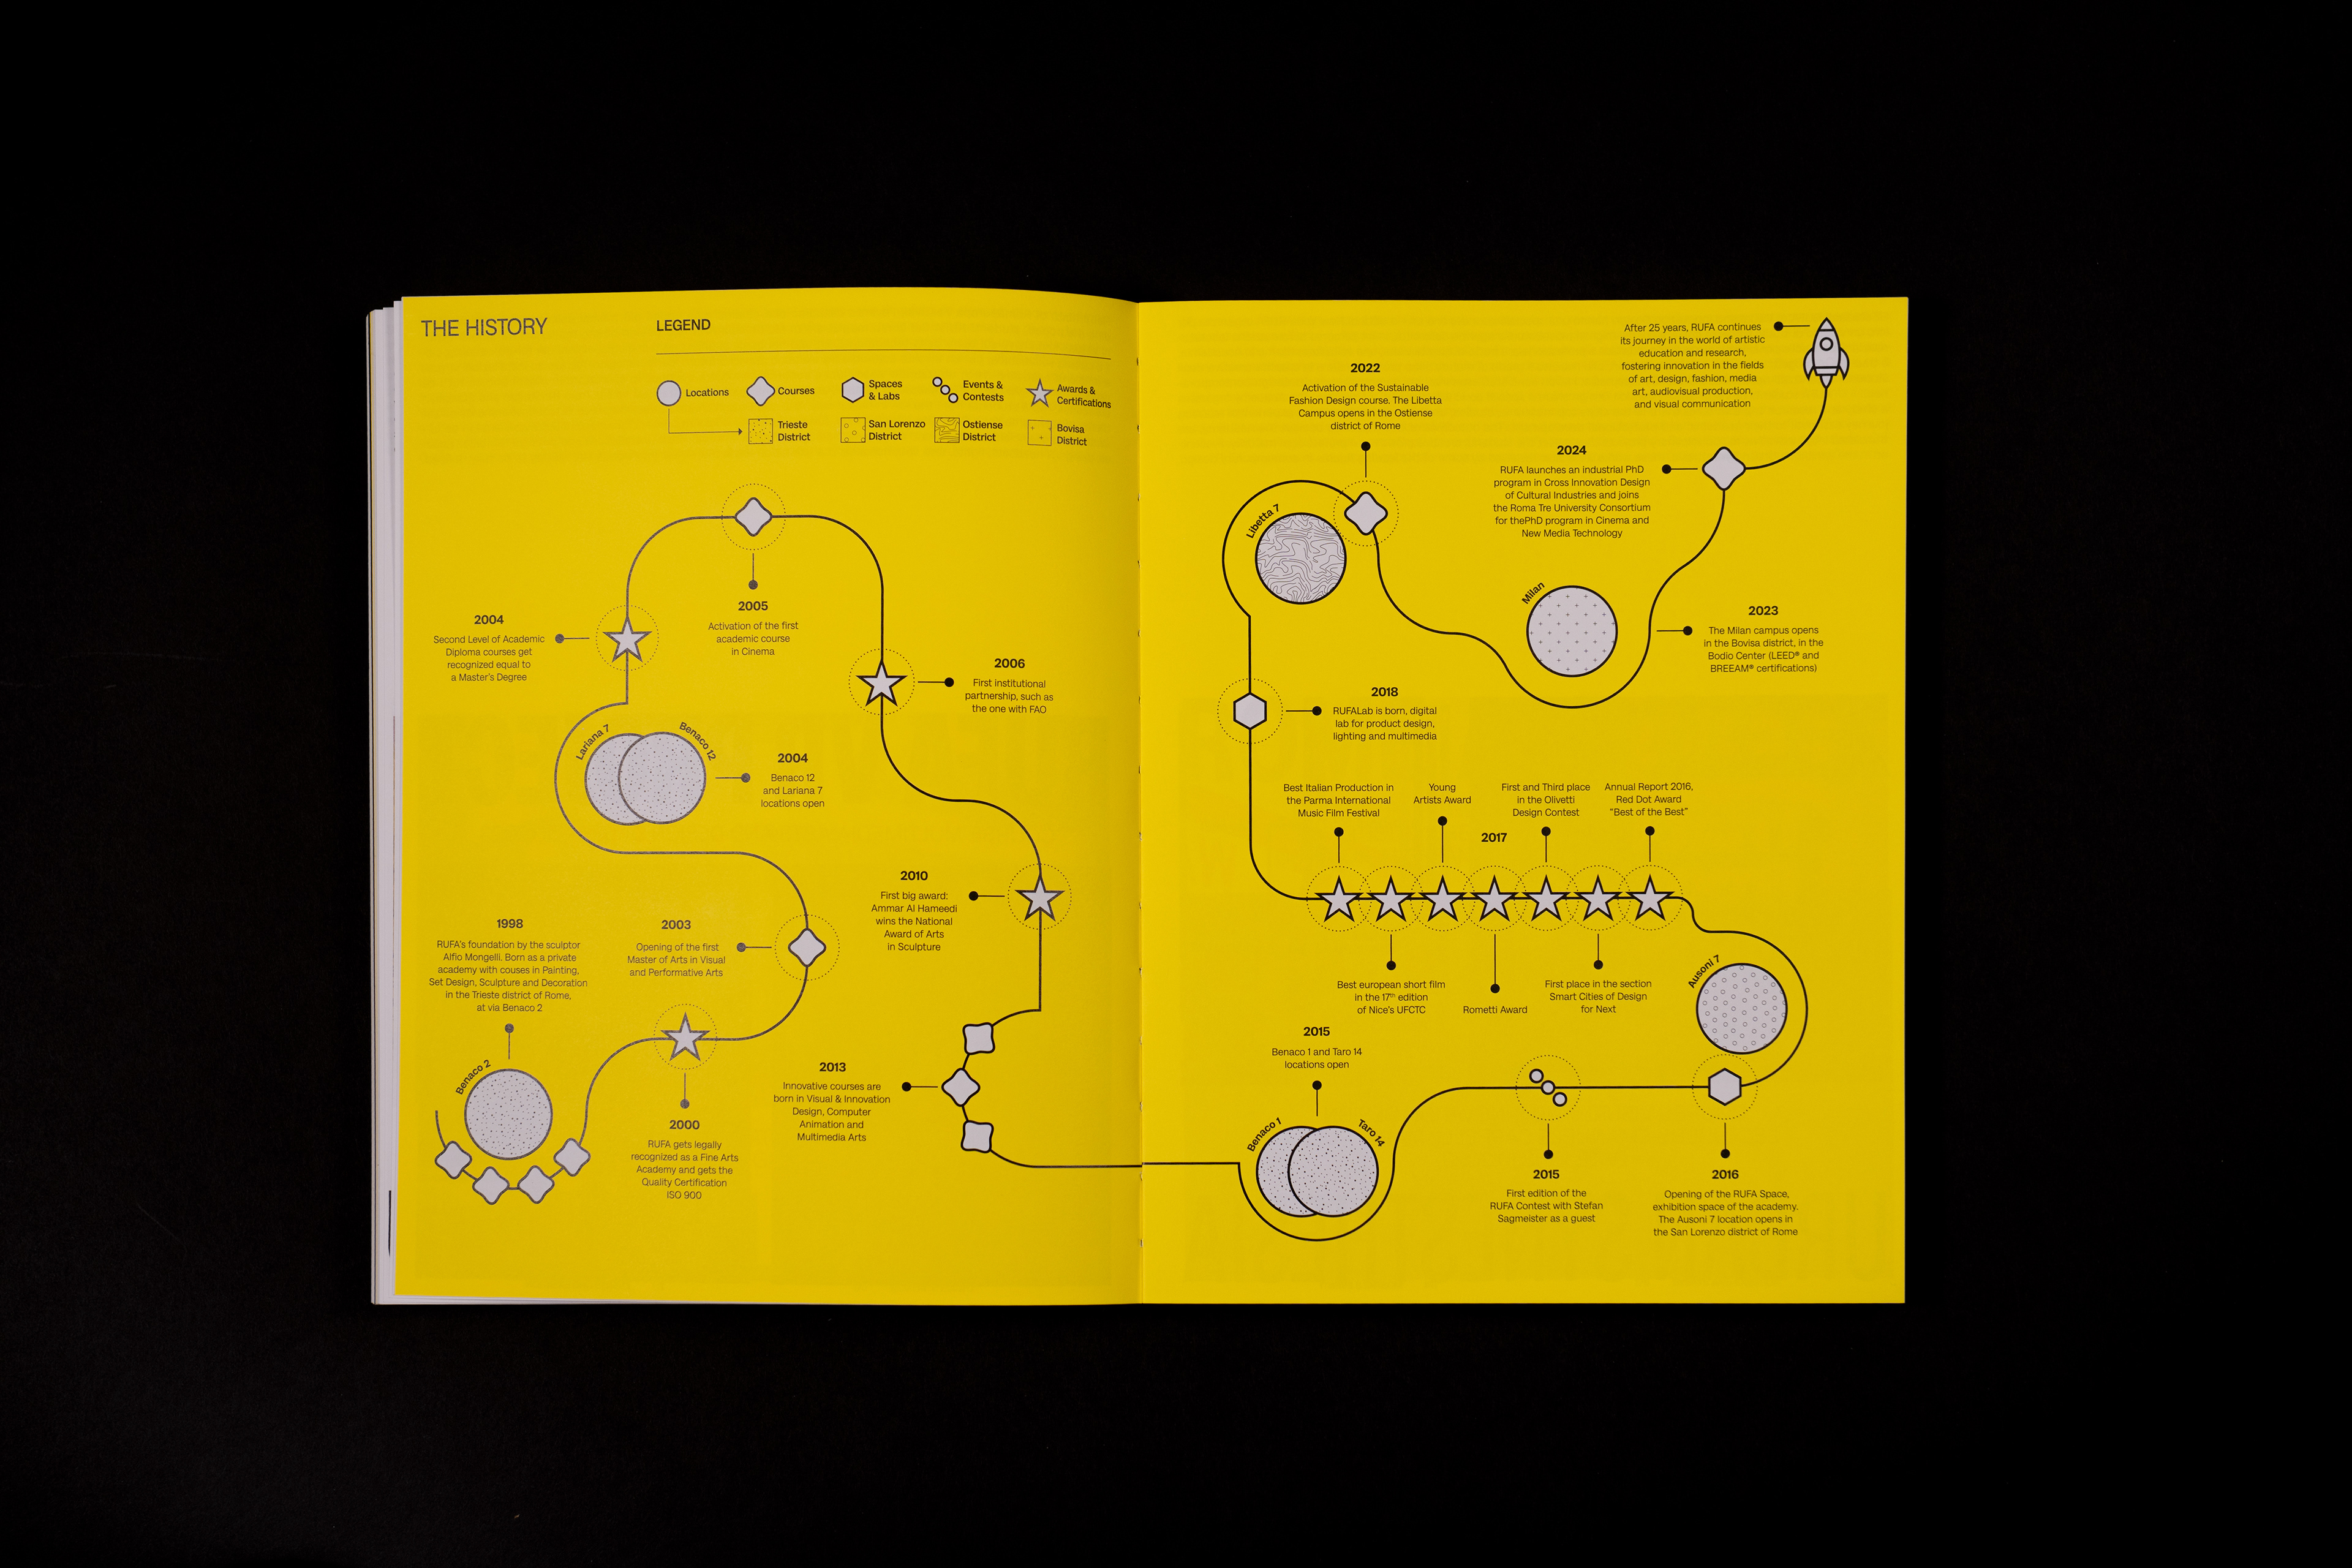
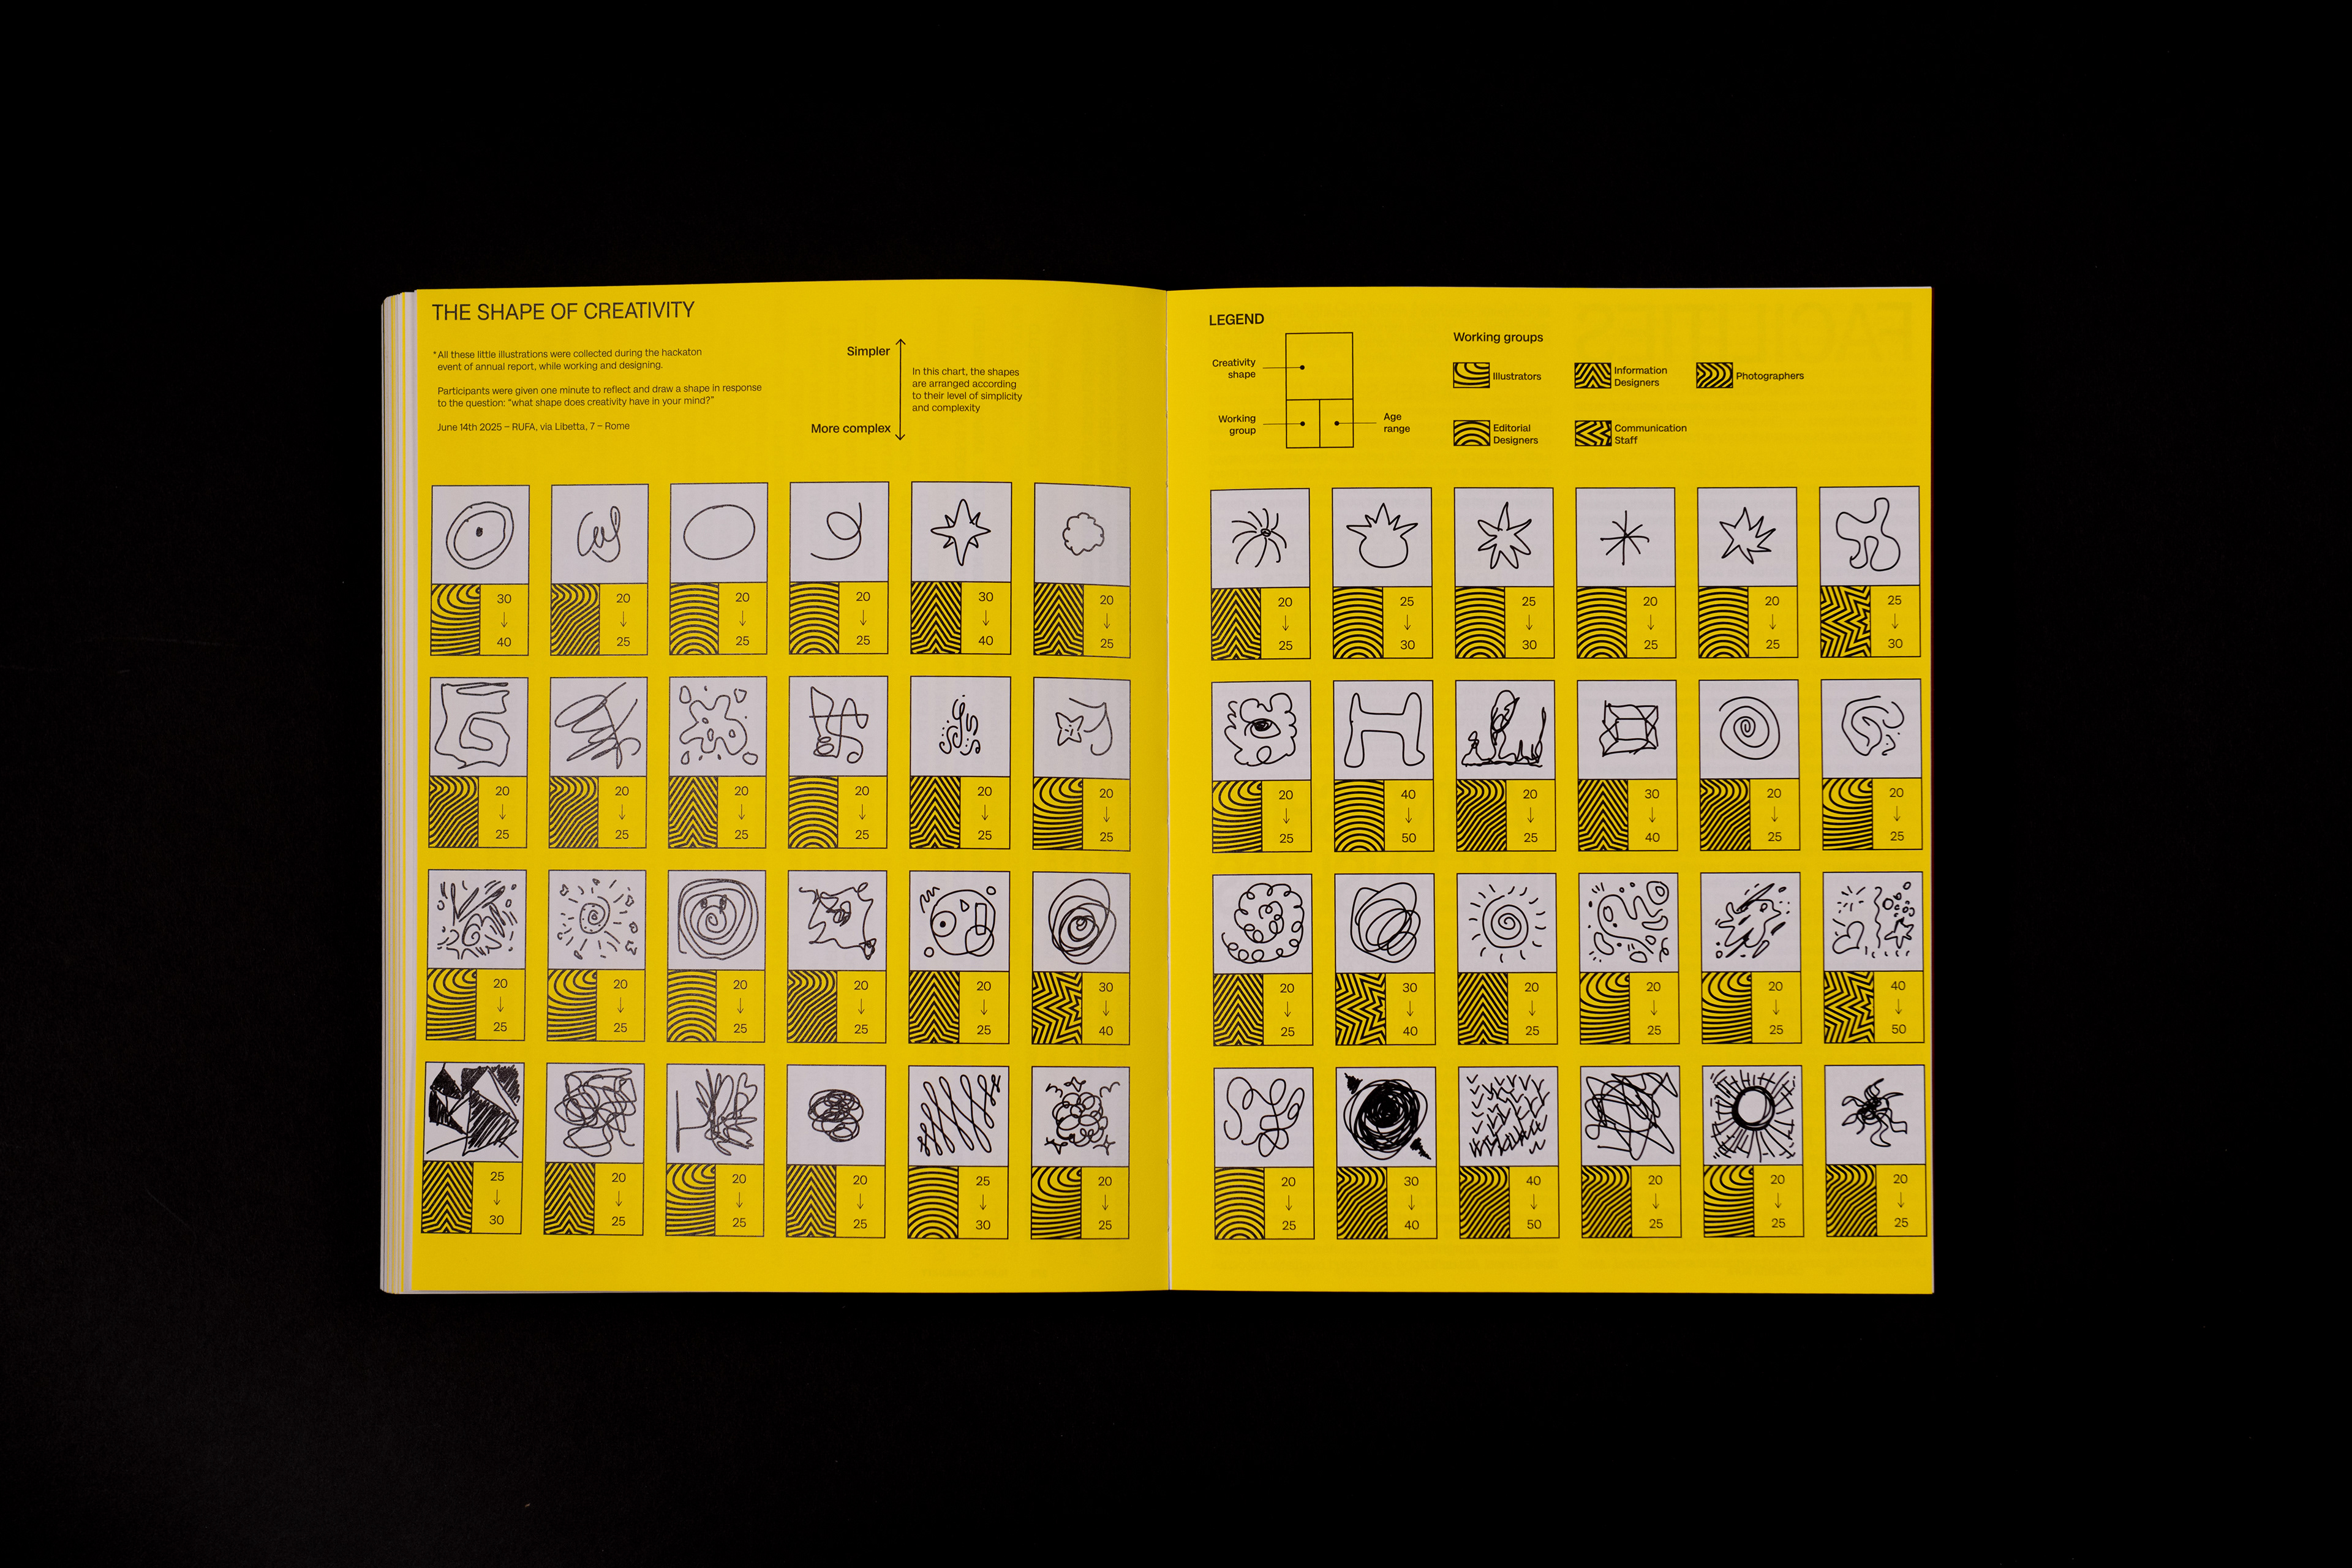
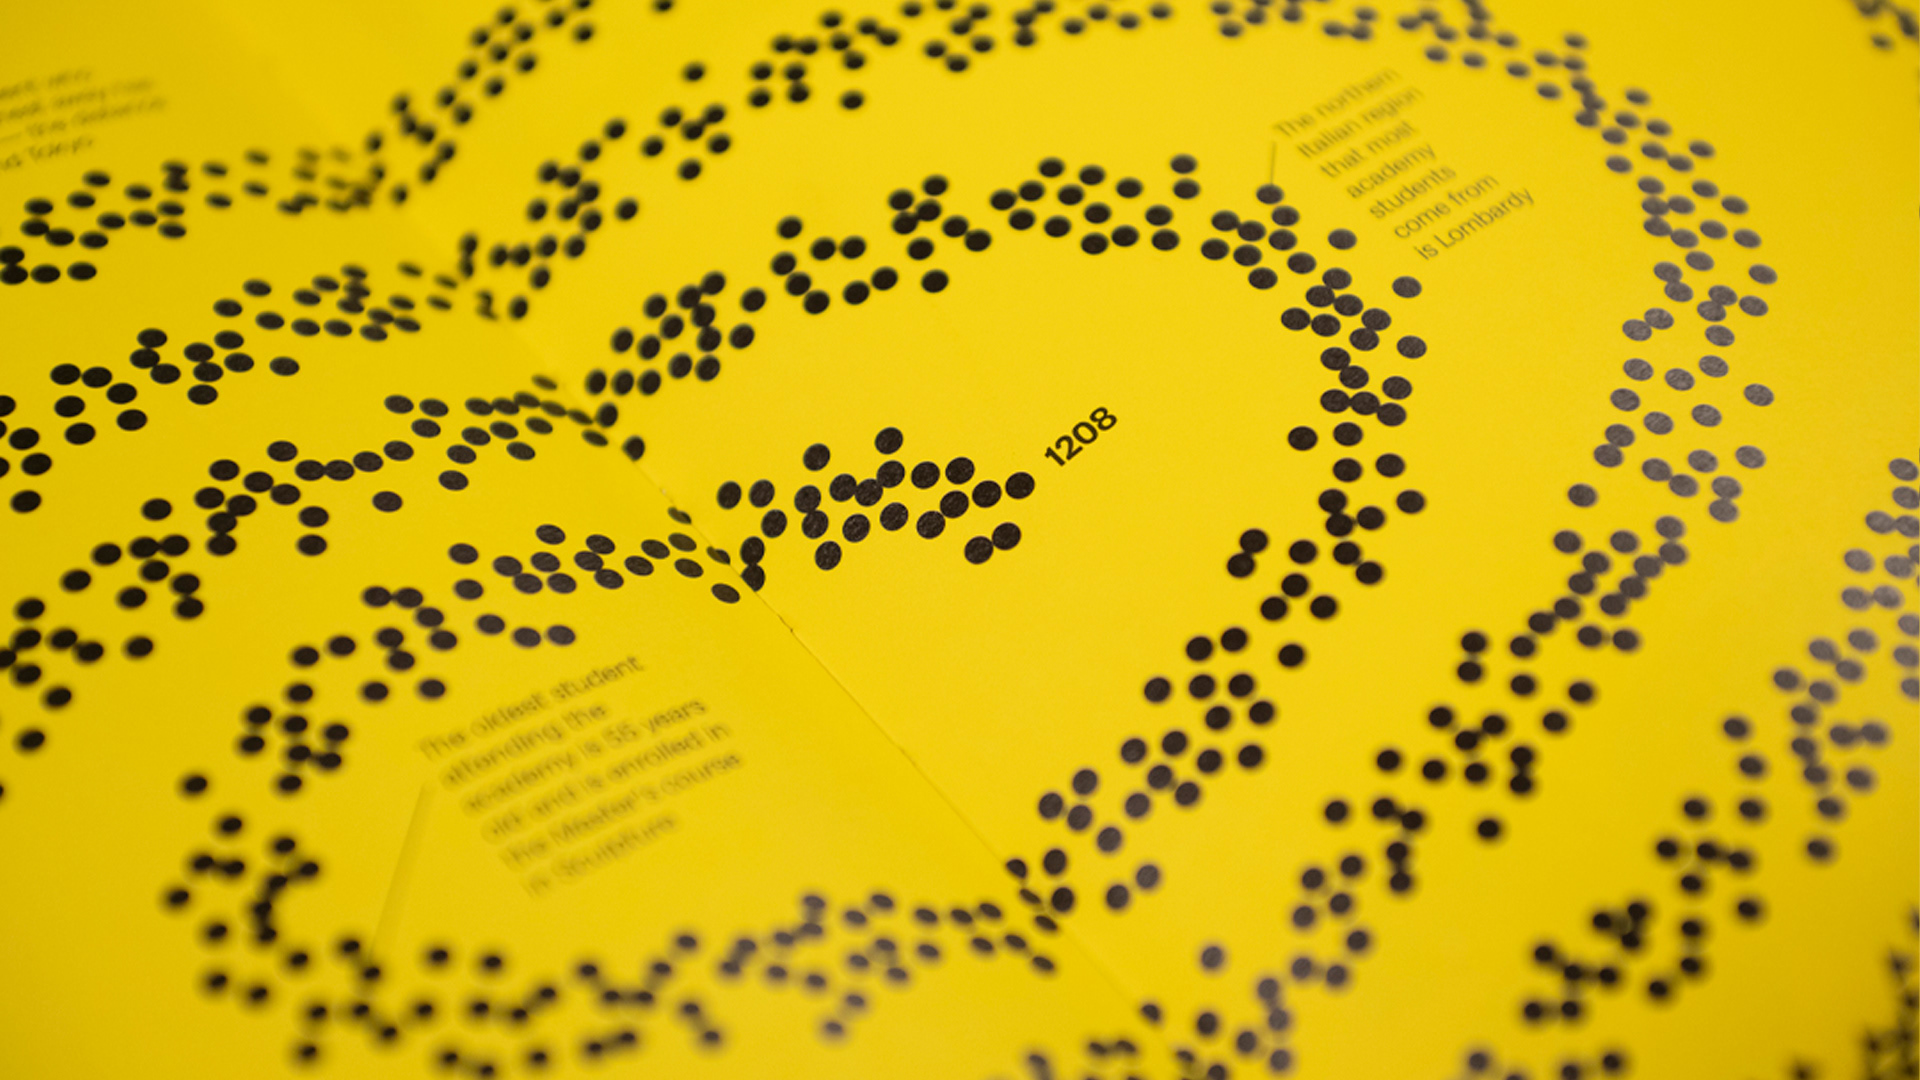
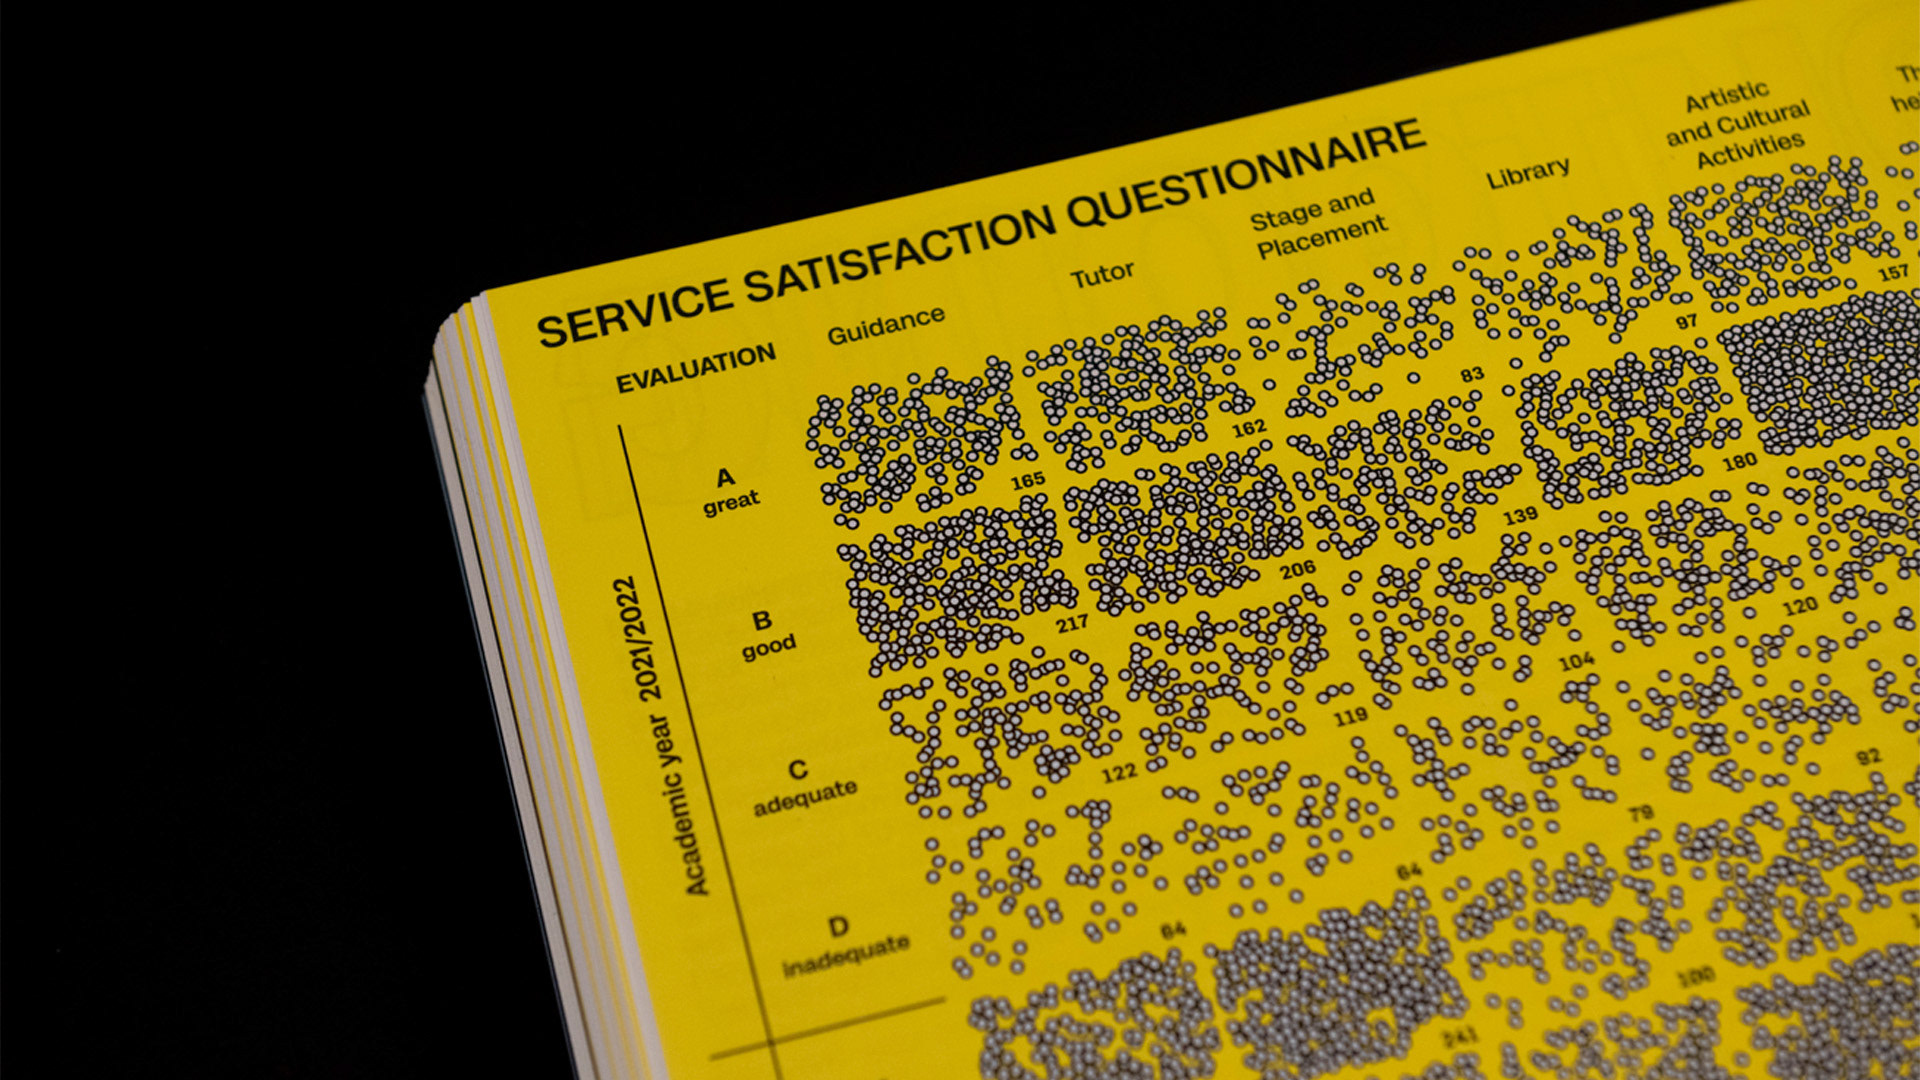
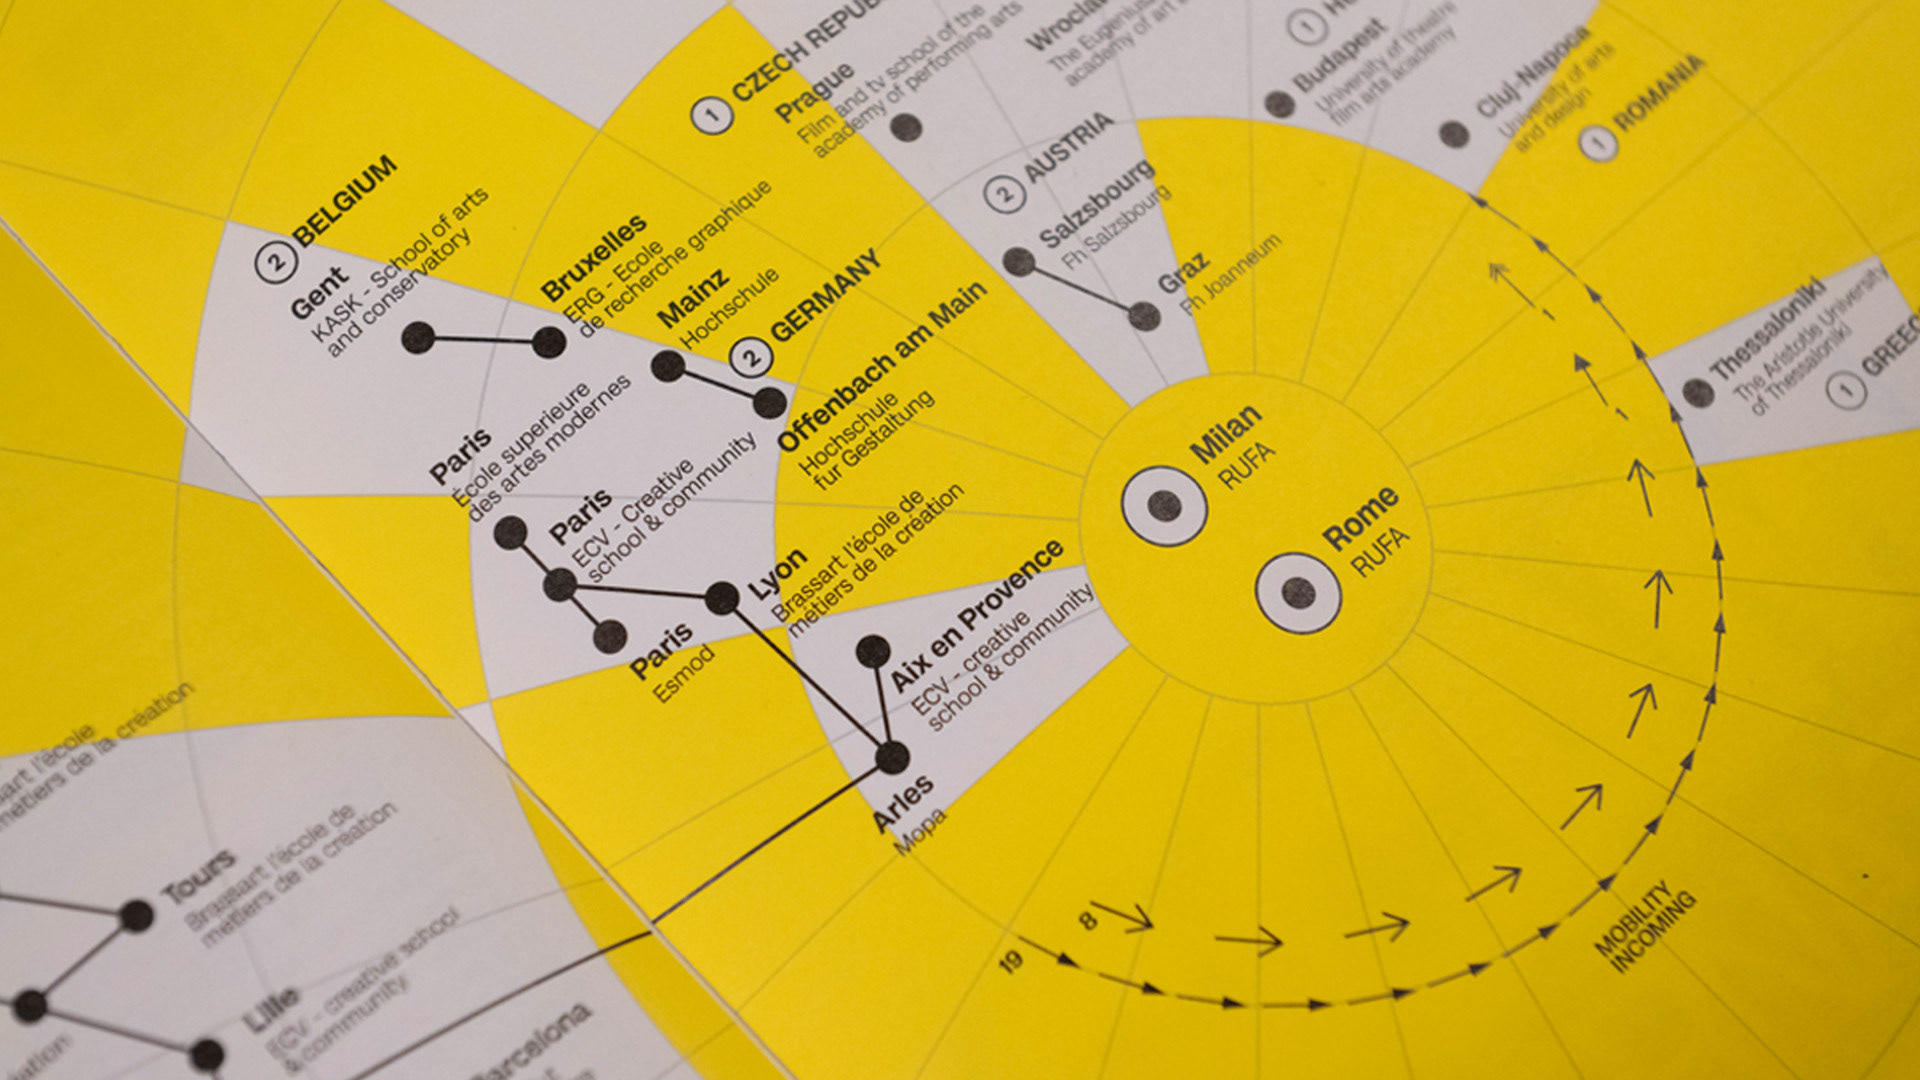
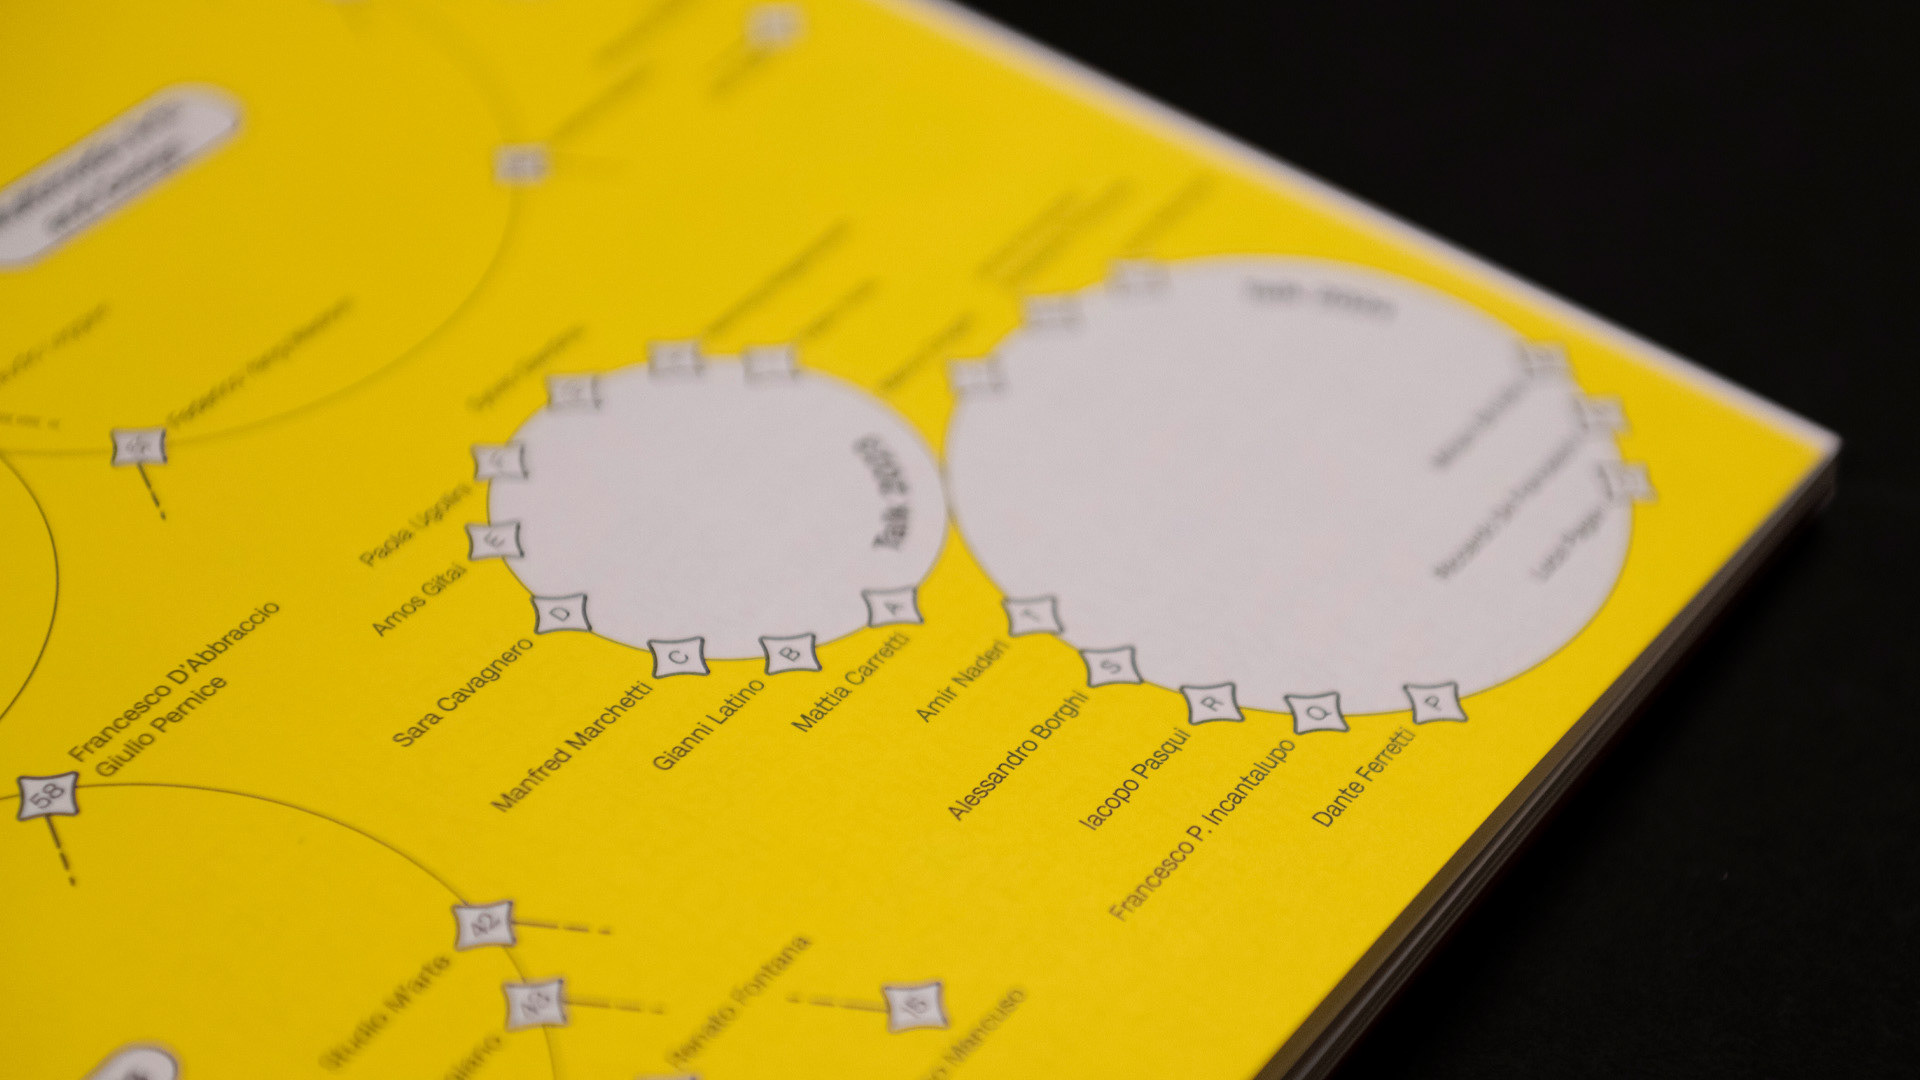
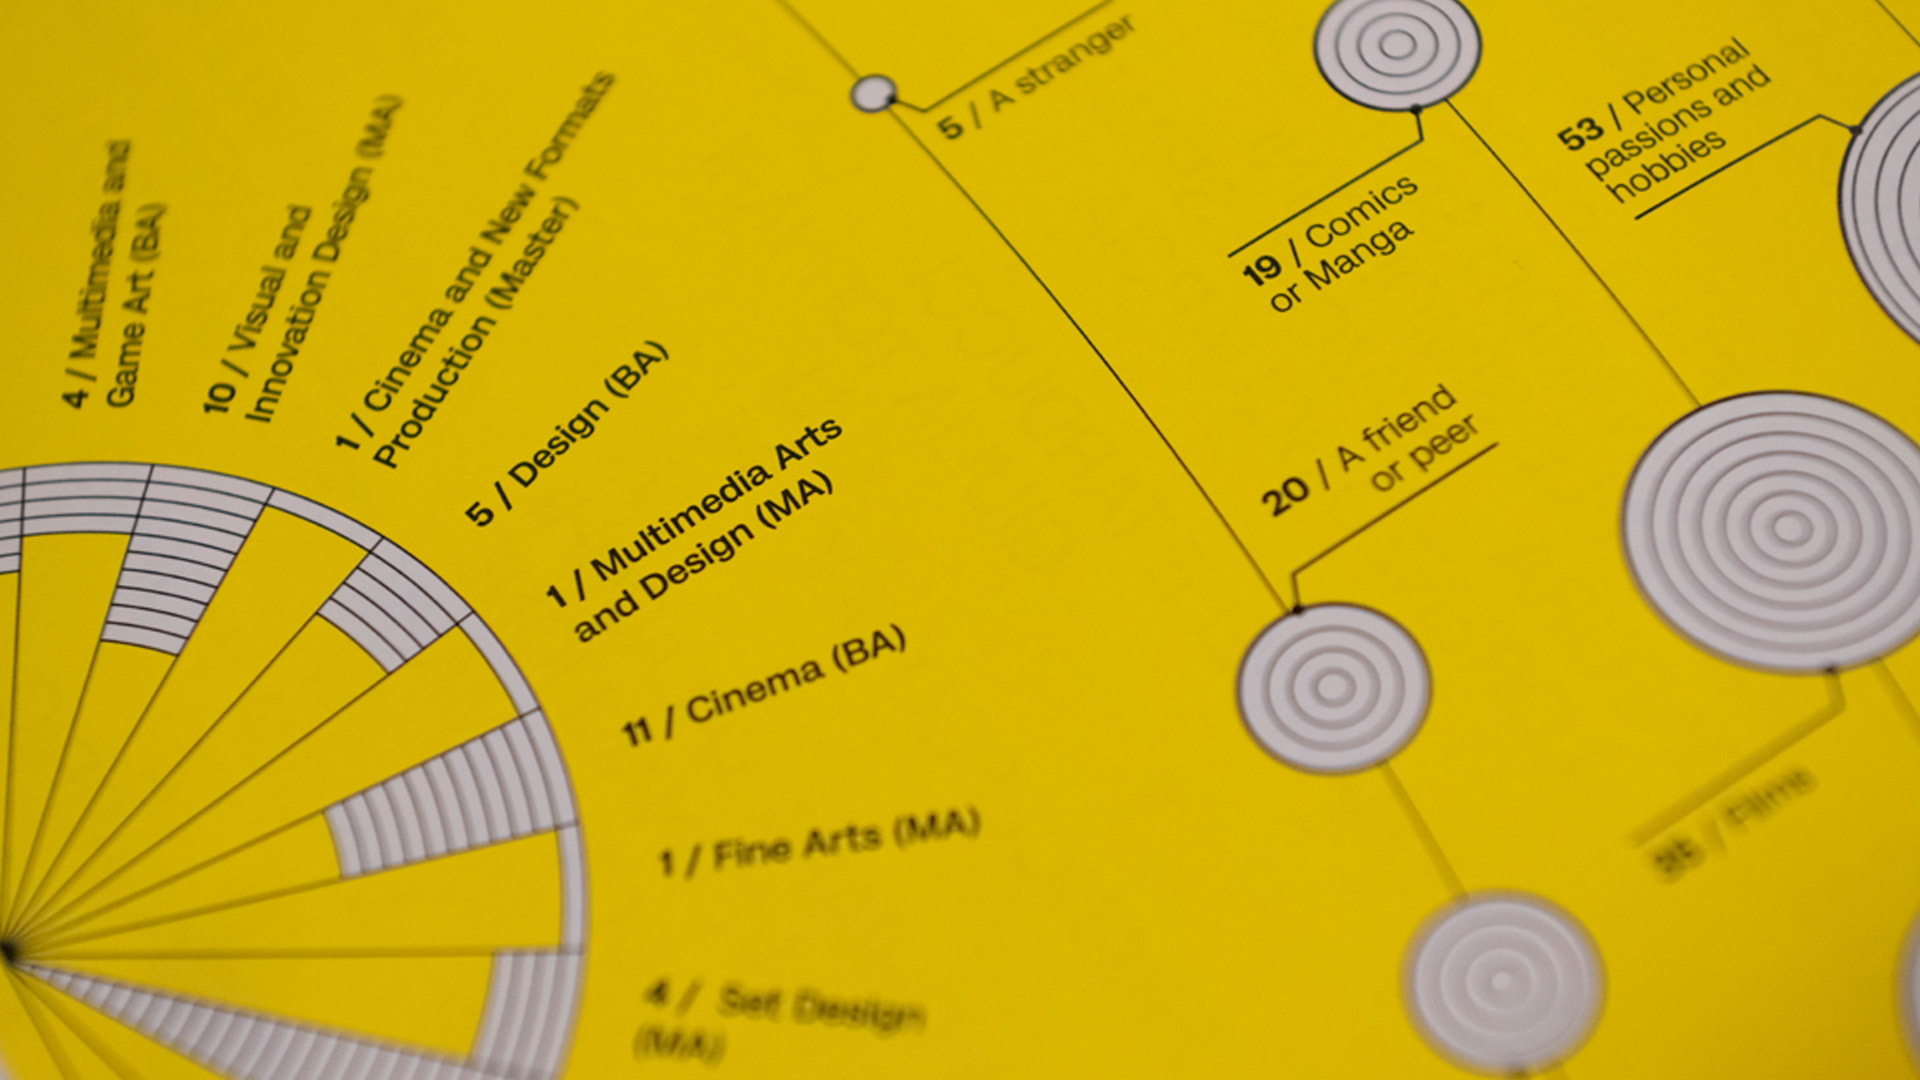
Series of data visualisations for the RUFA Annual Report 23-24. To describe the Academy’s universe, the main source of inspiration came from astronomical visualisations: galaxies, planets, orbits, stars and meteorites. The infographic team started from data collection, combining quantitative information — such as history, key figures, the Erasmus+ map, academic programmes, events and campuses — with qualitative data, including a questionnaire on creativity and service satisfaction completed by the Academy’s students, a set of questions for first-year students aimed at exploring their expectations, and a formal study on how the entire team envisions and interprets the creative process.
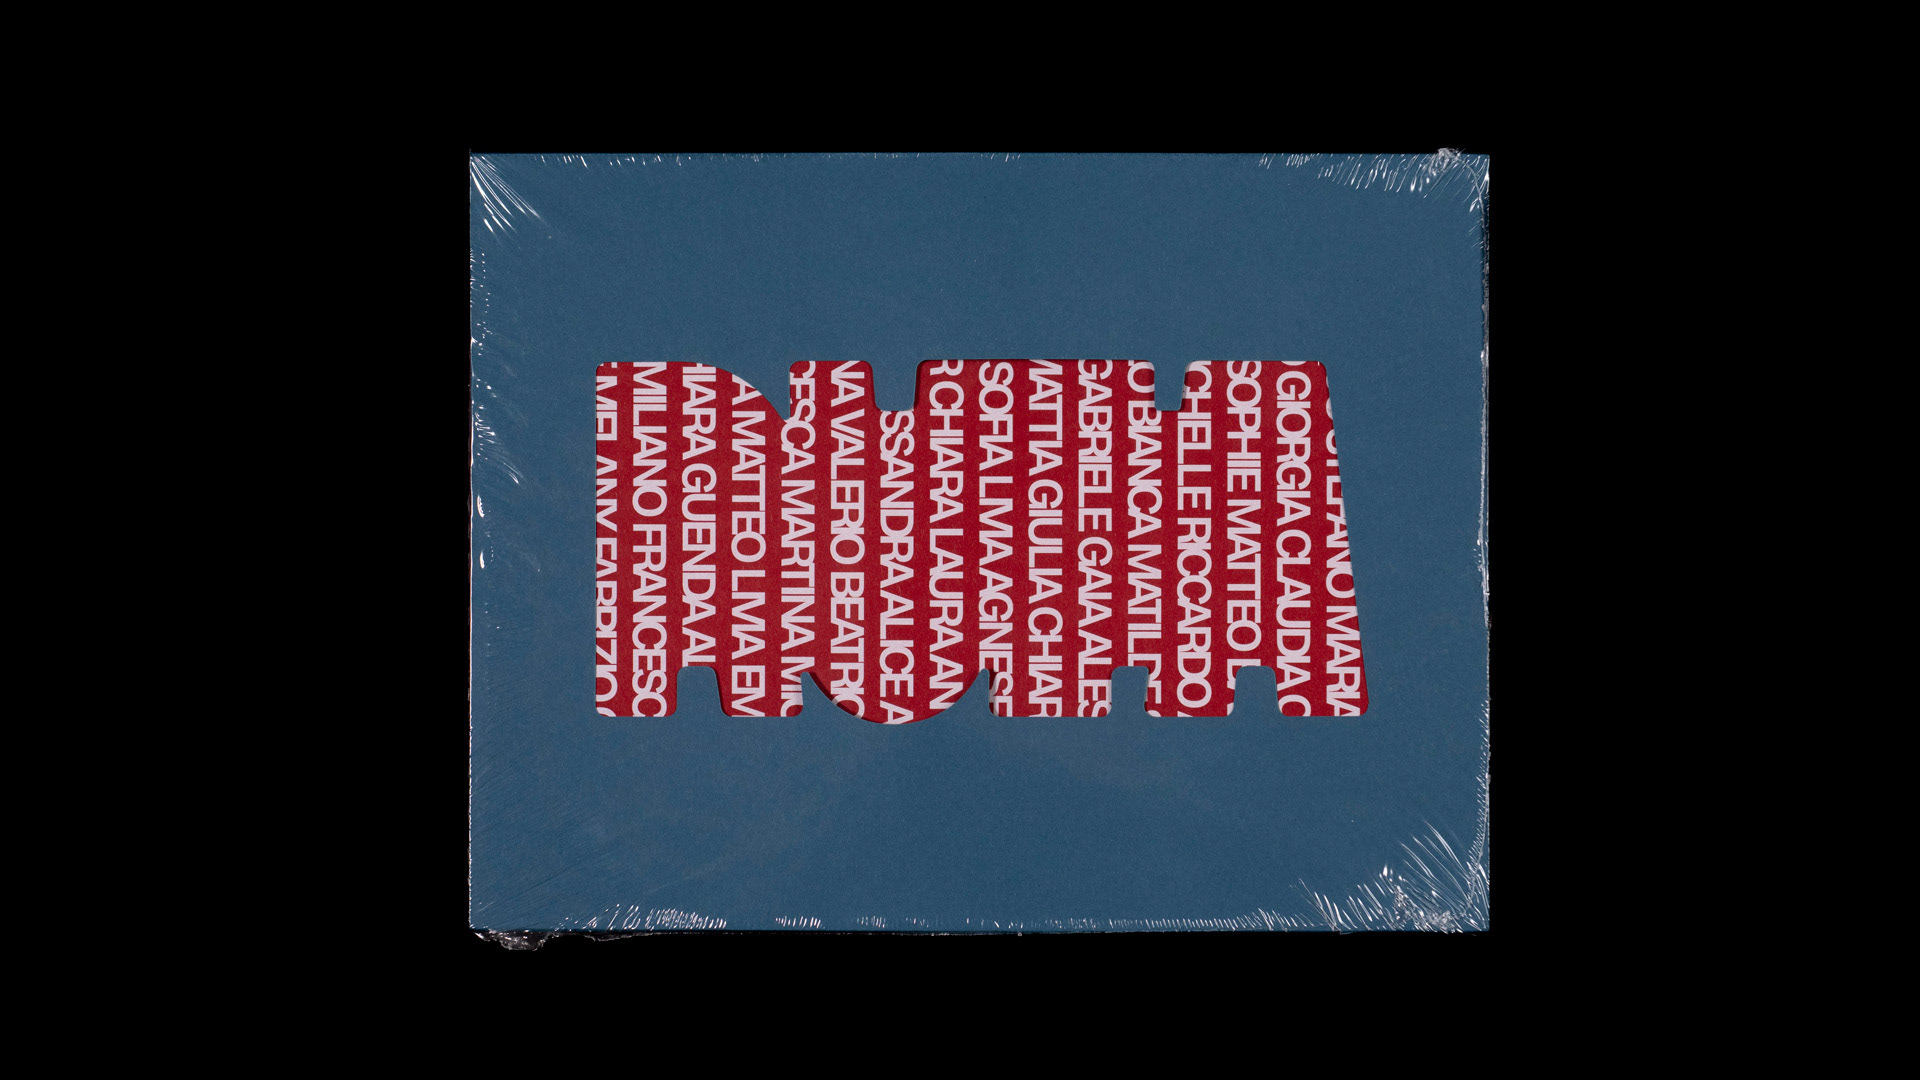
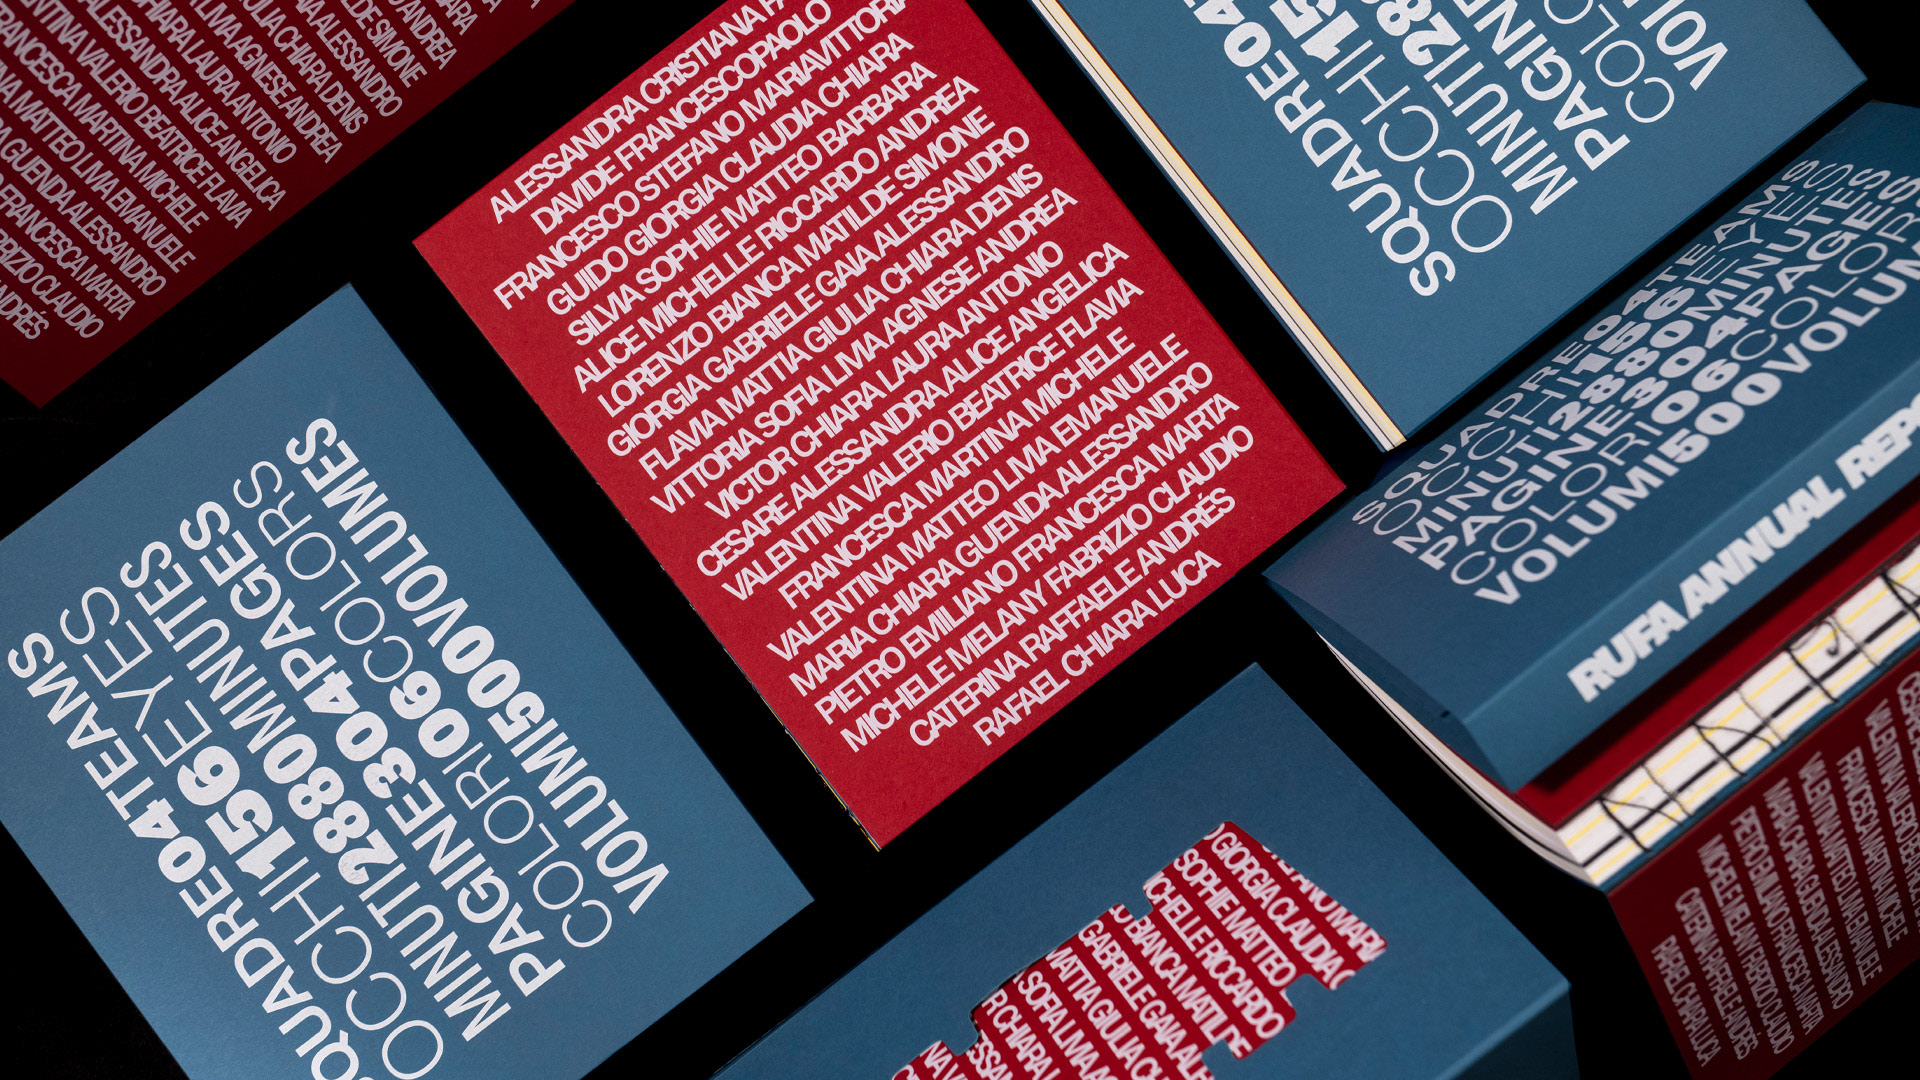
Printed using Pantone Fluorescent Yellow ink. Typeface Milligram by Zetafonts
Printed using Pantone Fluorescent Yellow ink. Typeface Milligram by Zetafonts
MAKING OF
The 2023–24 edition of the RUFA Annual Report, conceived as a collective performance, goes beyond documenting the year’s activities to become a shared design act focused on intention, process, and collaboration. Inspired by Vilém Flusser’s idea that “everything depends on intention (design),” the Report was created through a 48-hour creative marathon involving 50 selected students alongside designers, visual artists, photographers, copywriters, and faculty members. Working together in an open laboratory, the teams produced content, images, data, and narratives that shaped the final publication.
The students presented the Annual Report to the RUFA faculty in December 2025.
INFOGRAPHIC TEAMThe students presented the Annual Report to the RUFA faculty in December 2025.
Flavia Basile, Mattia Capomagi, Giulia Cantini, Giulia Chiriani, Chiara De Siena, Denis D’Andrea, Vittoria Fornari, Sofia Paciotti, Livia Rosati, Chiara Tamburrini, Agnese Troncone
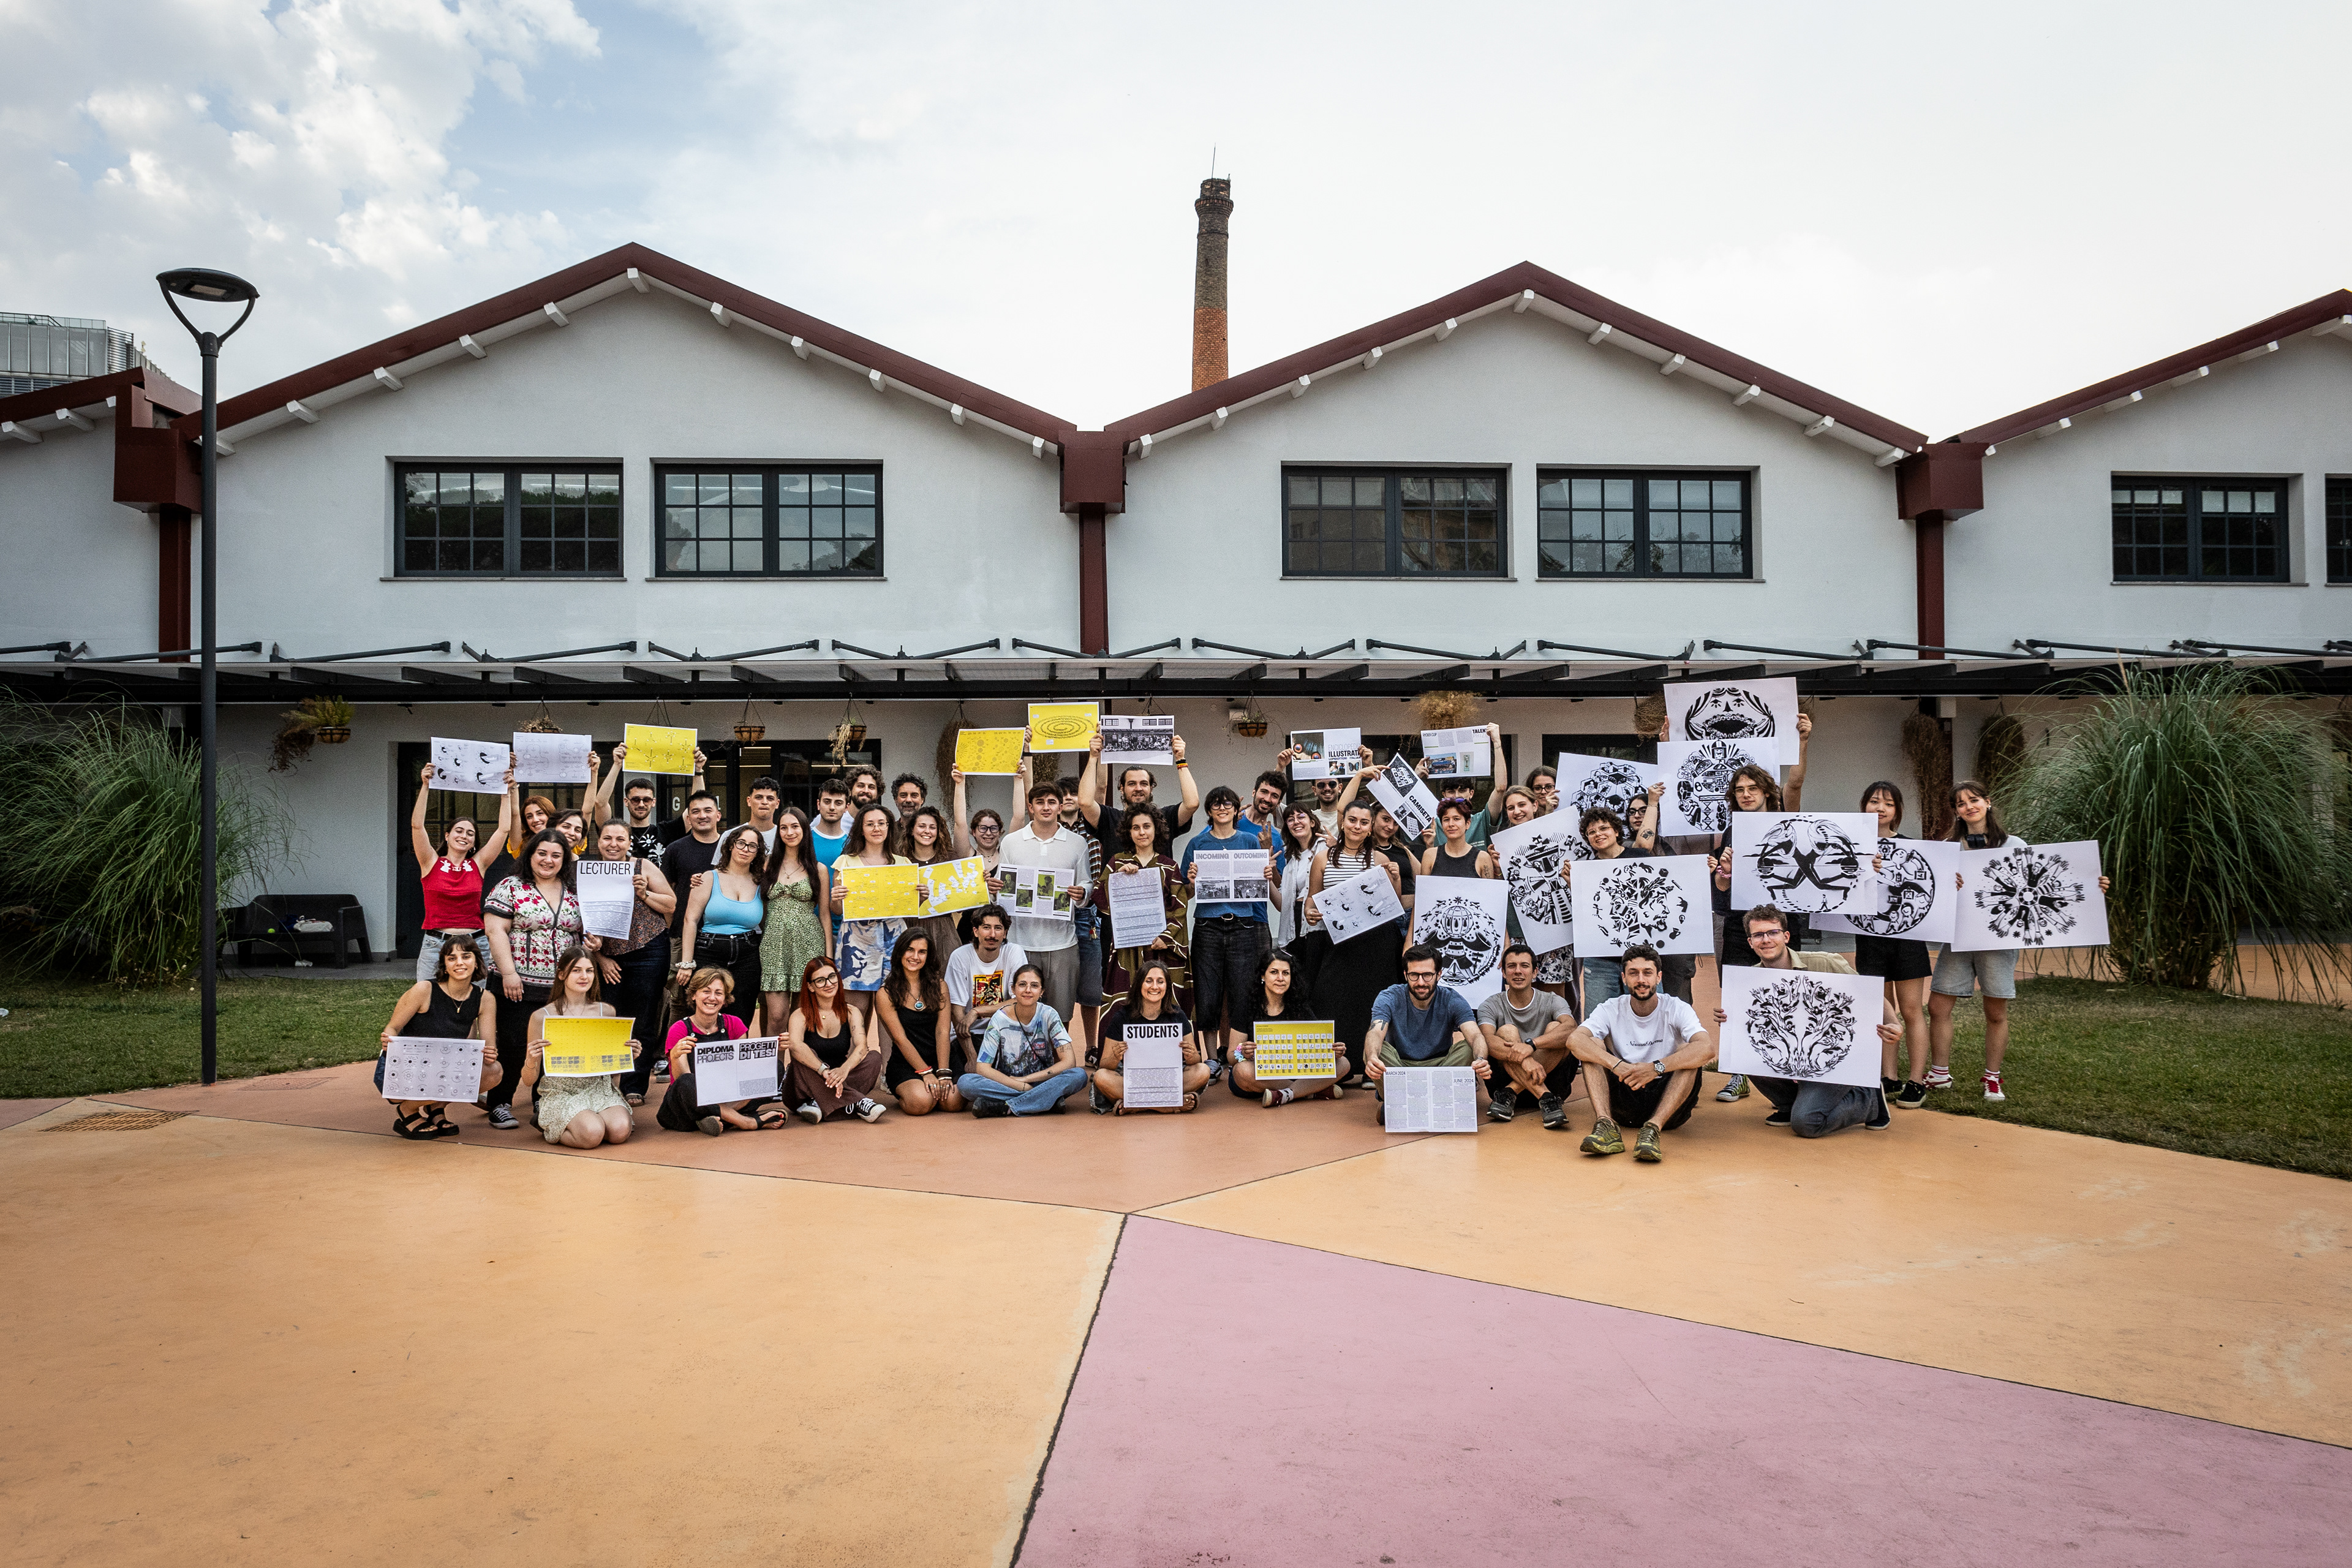
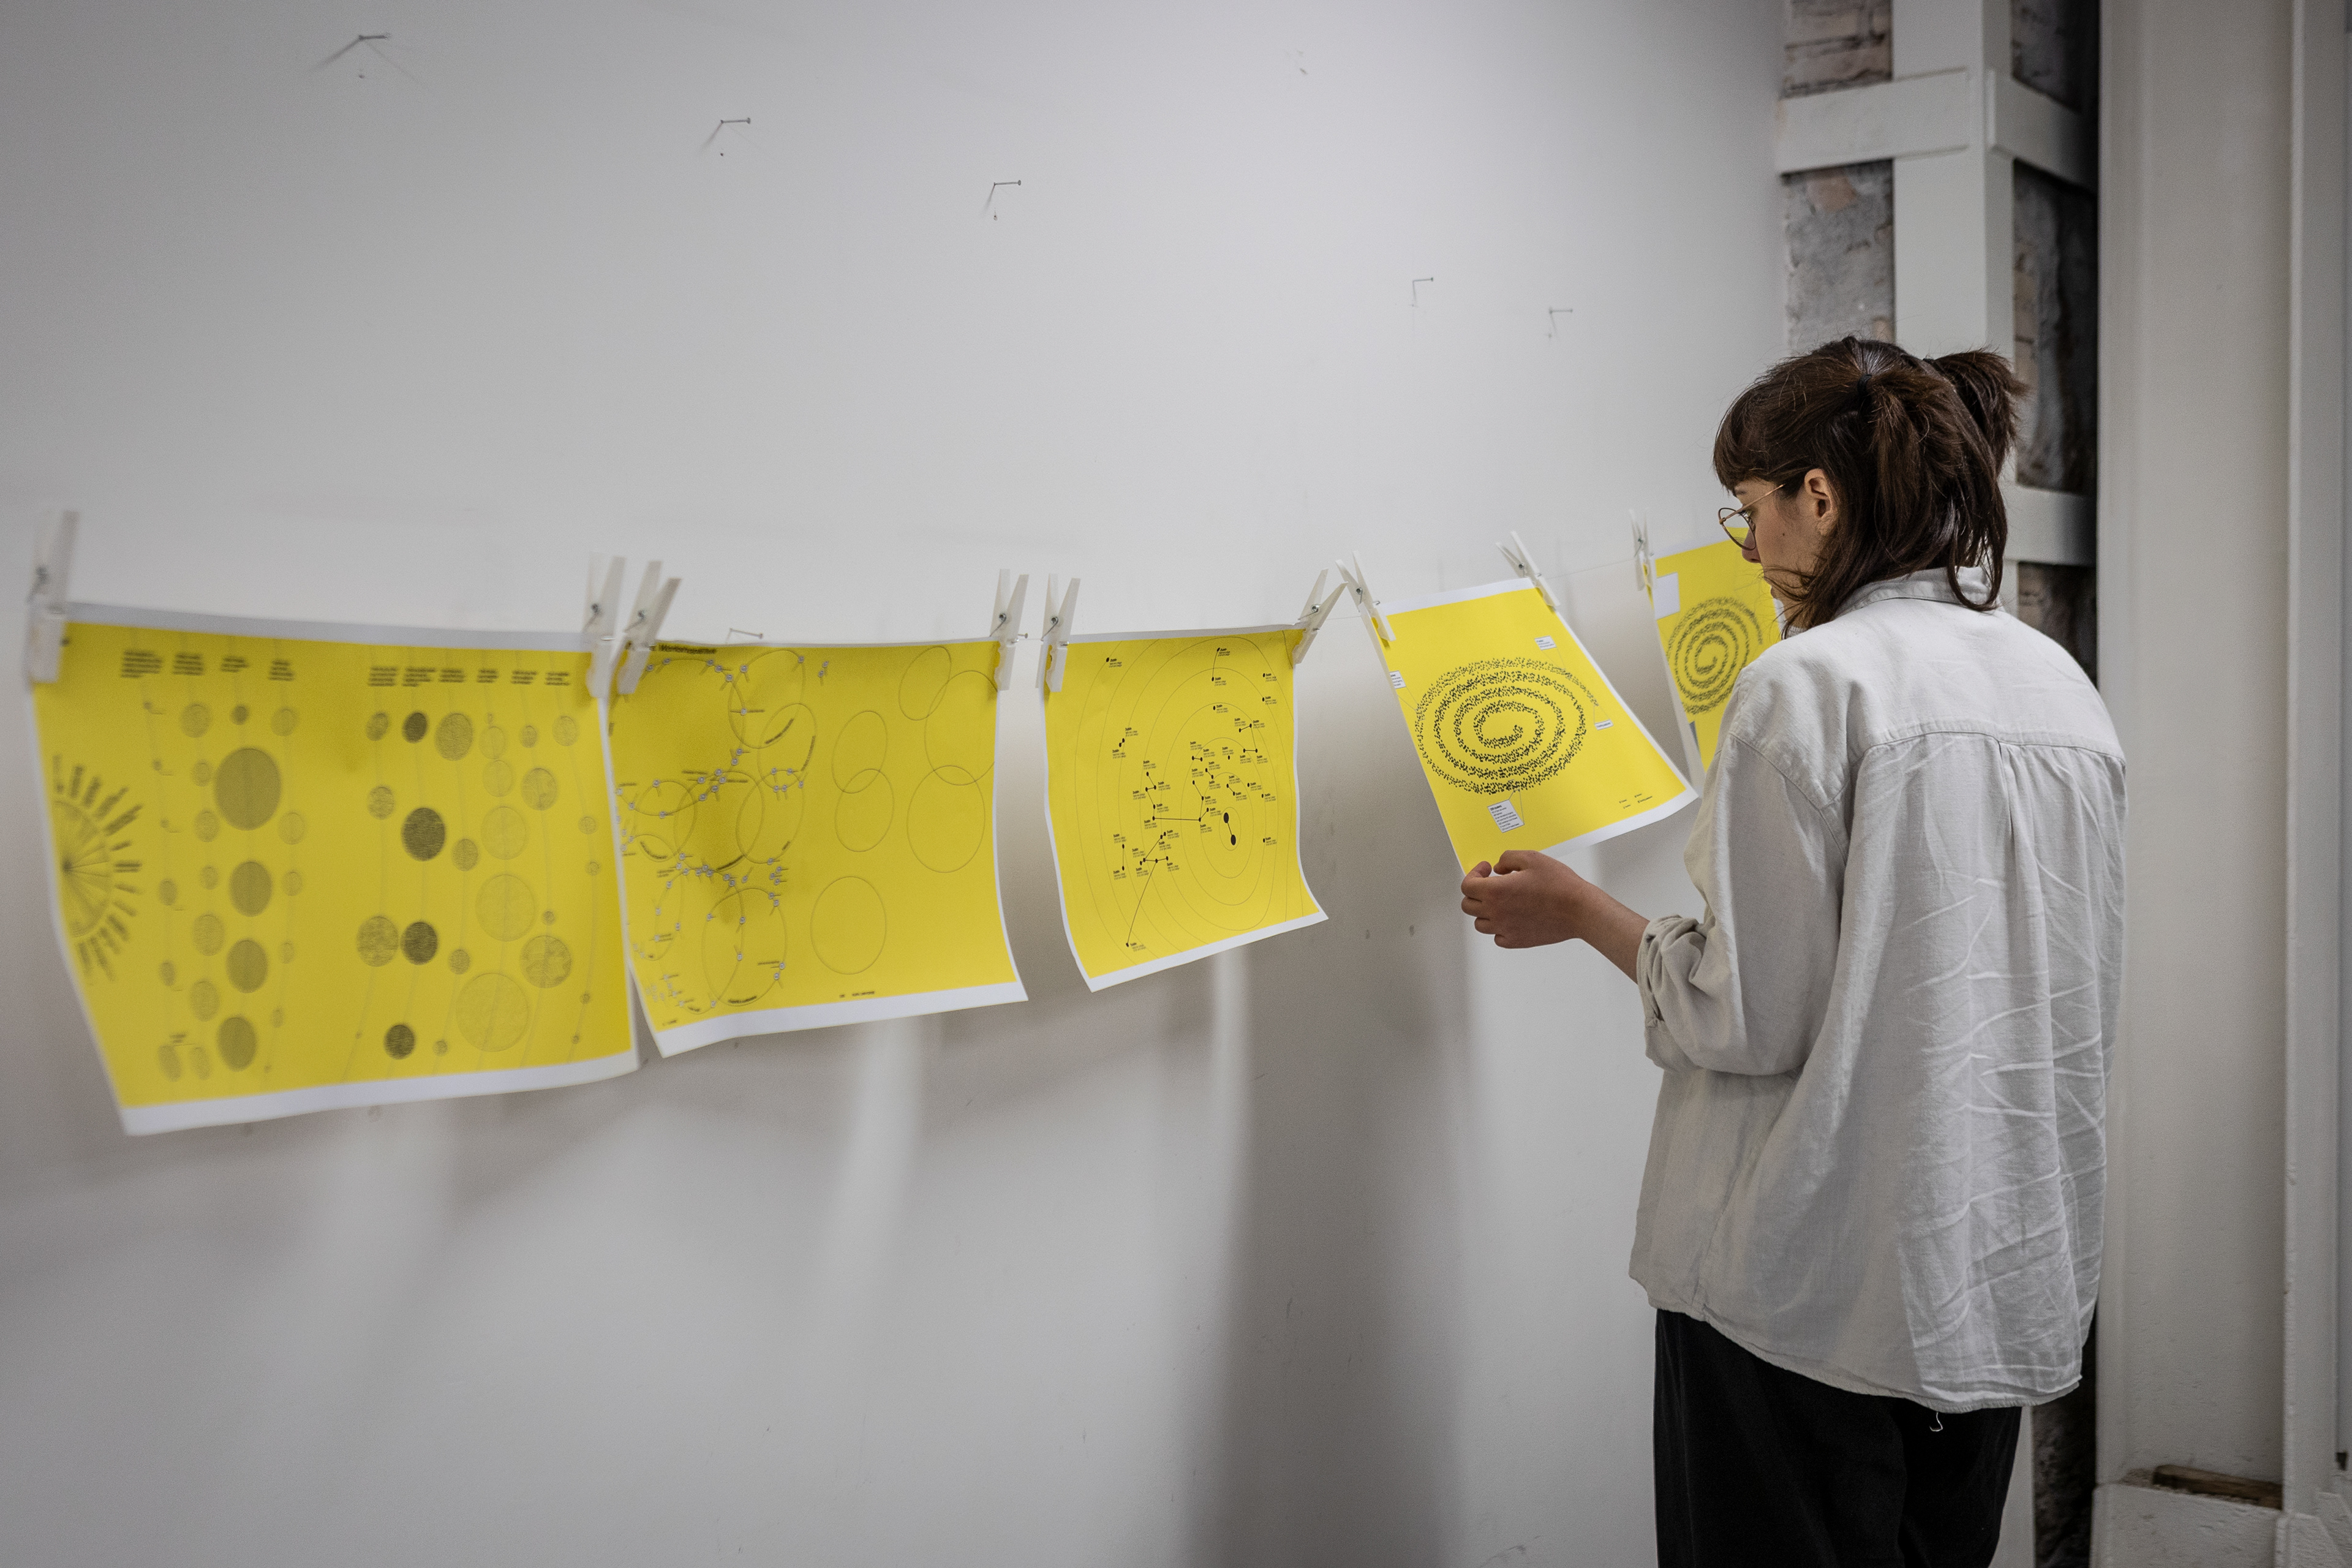
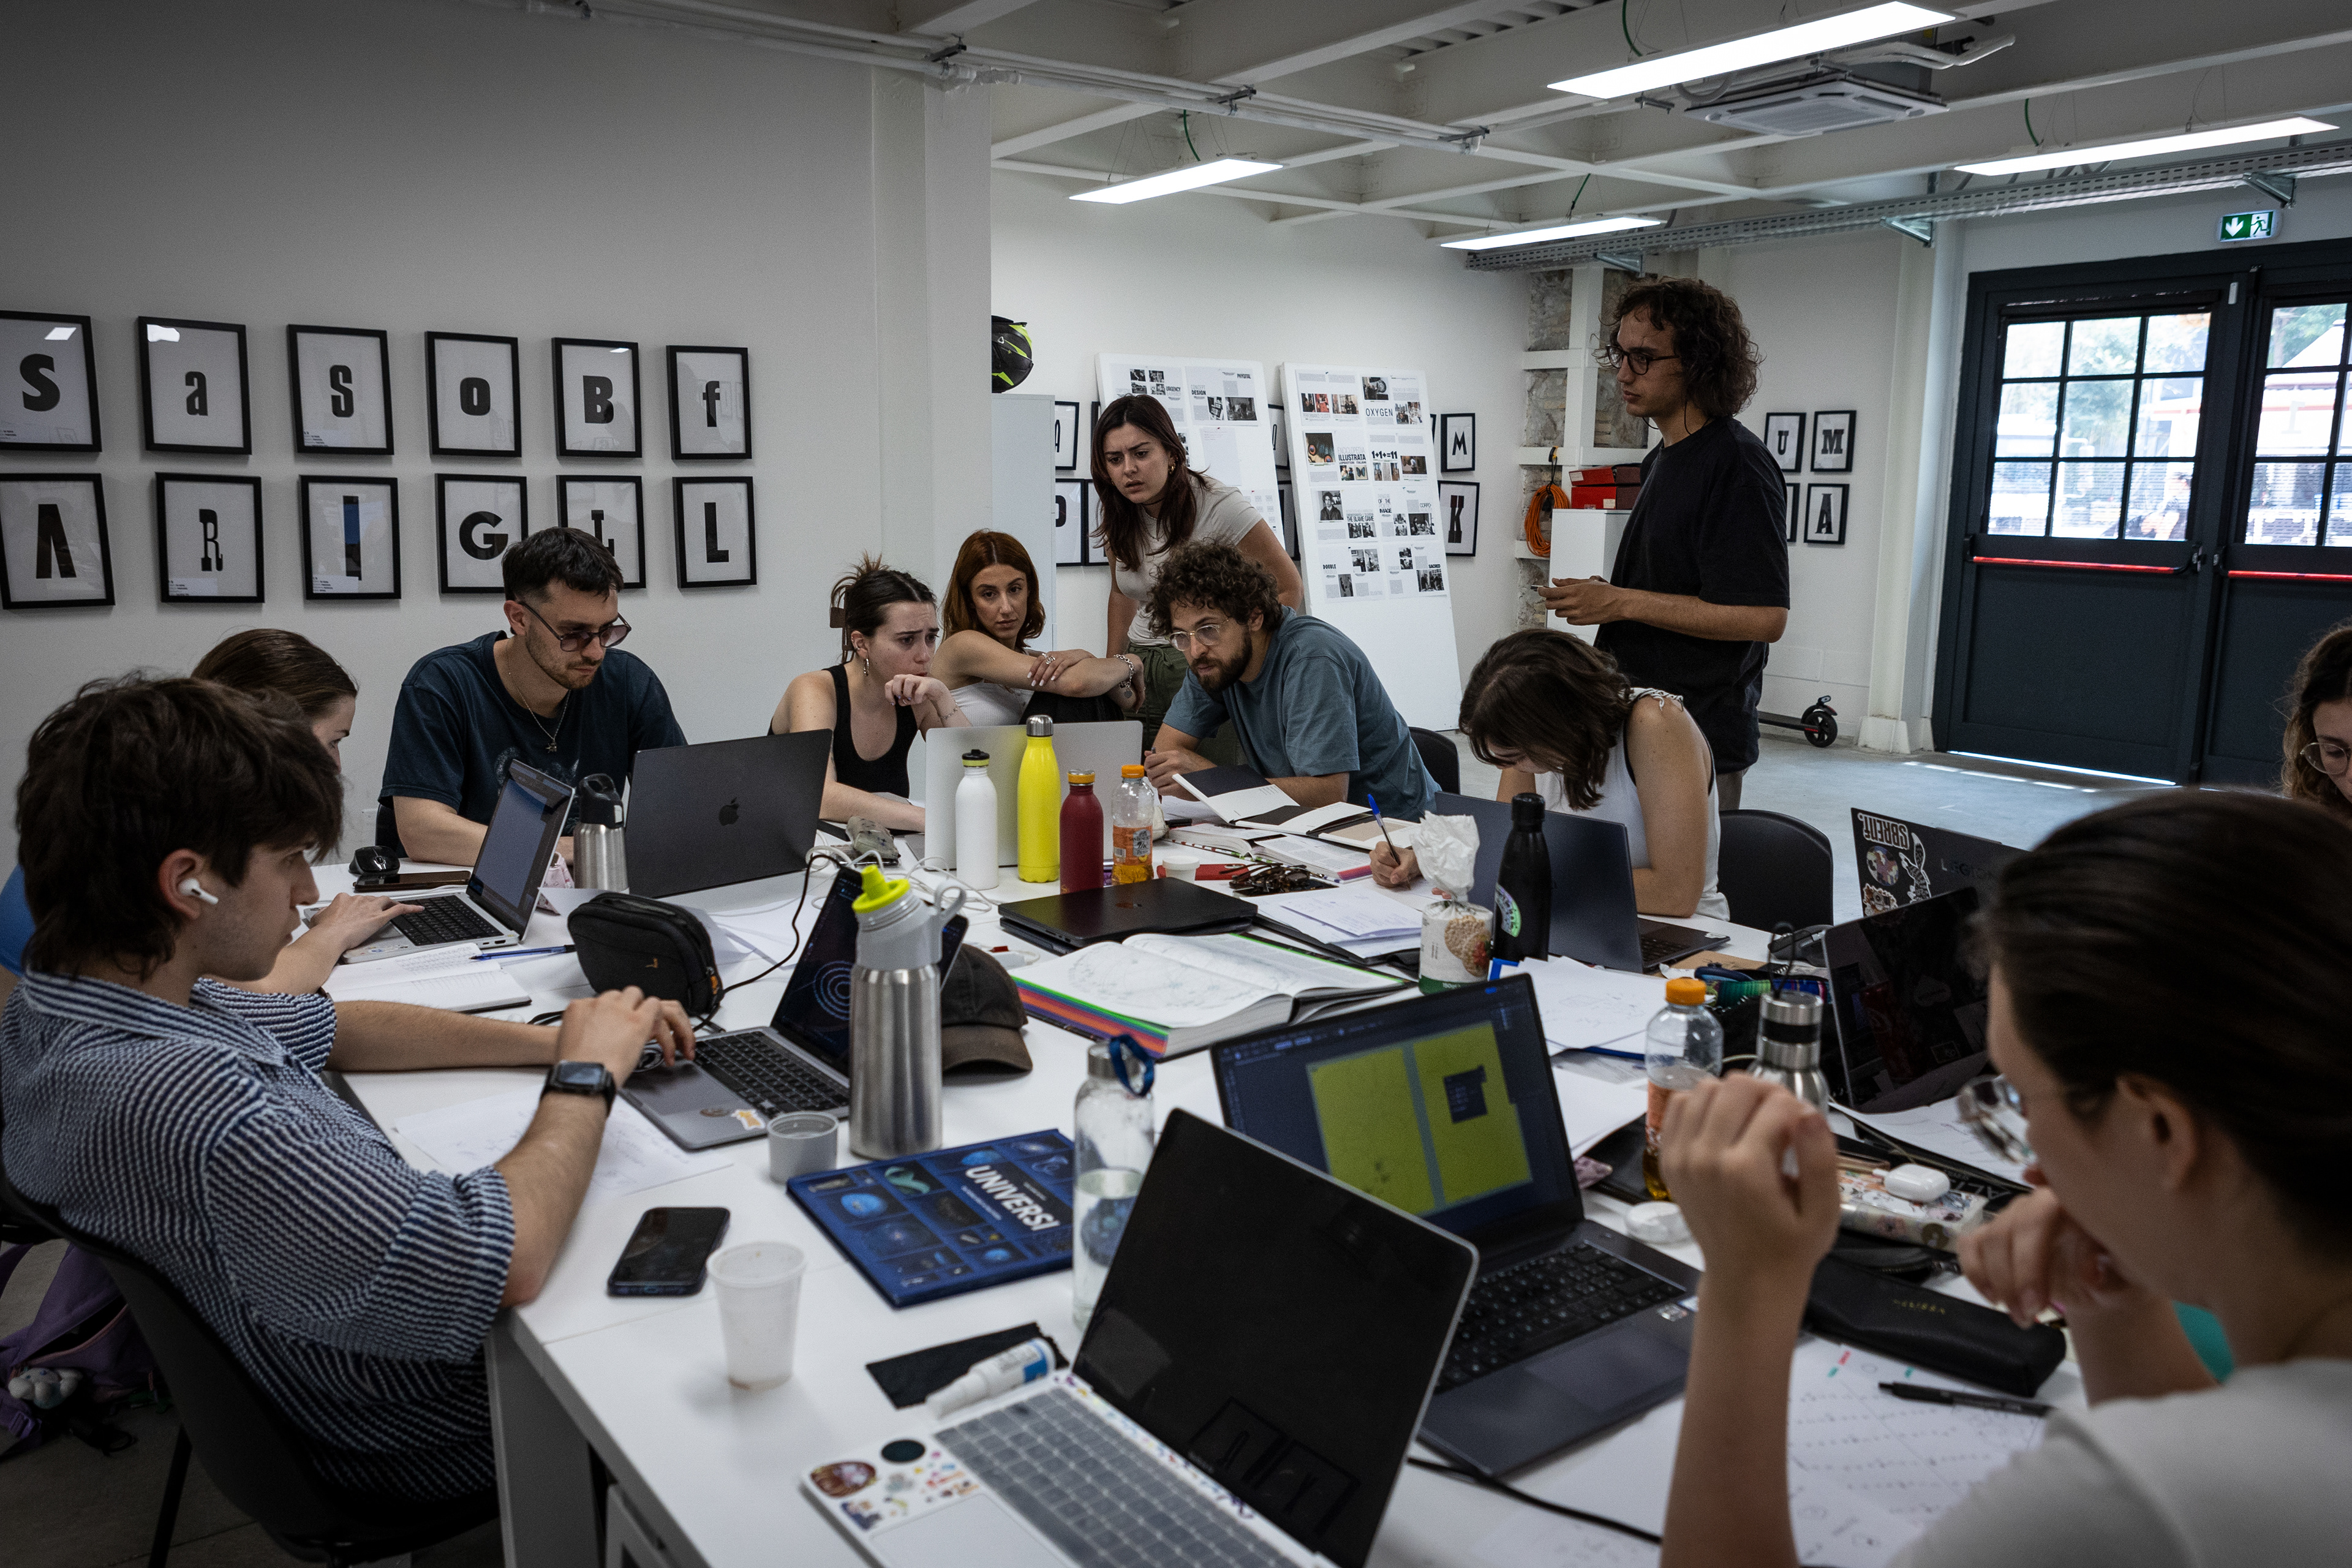
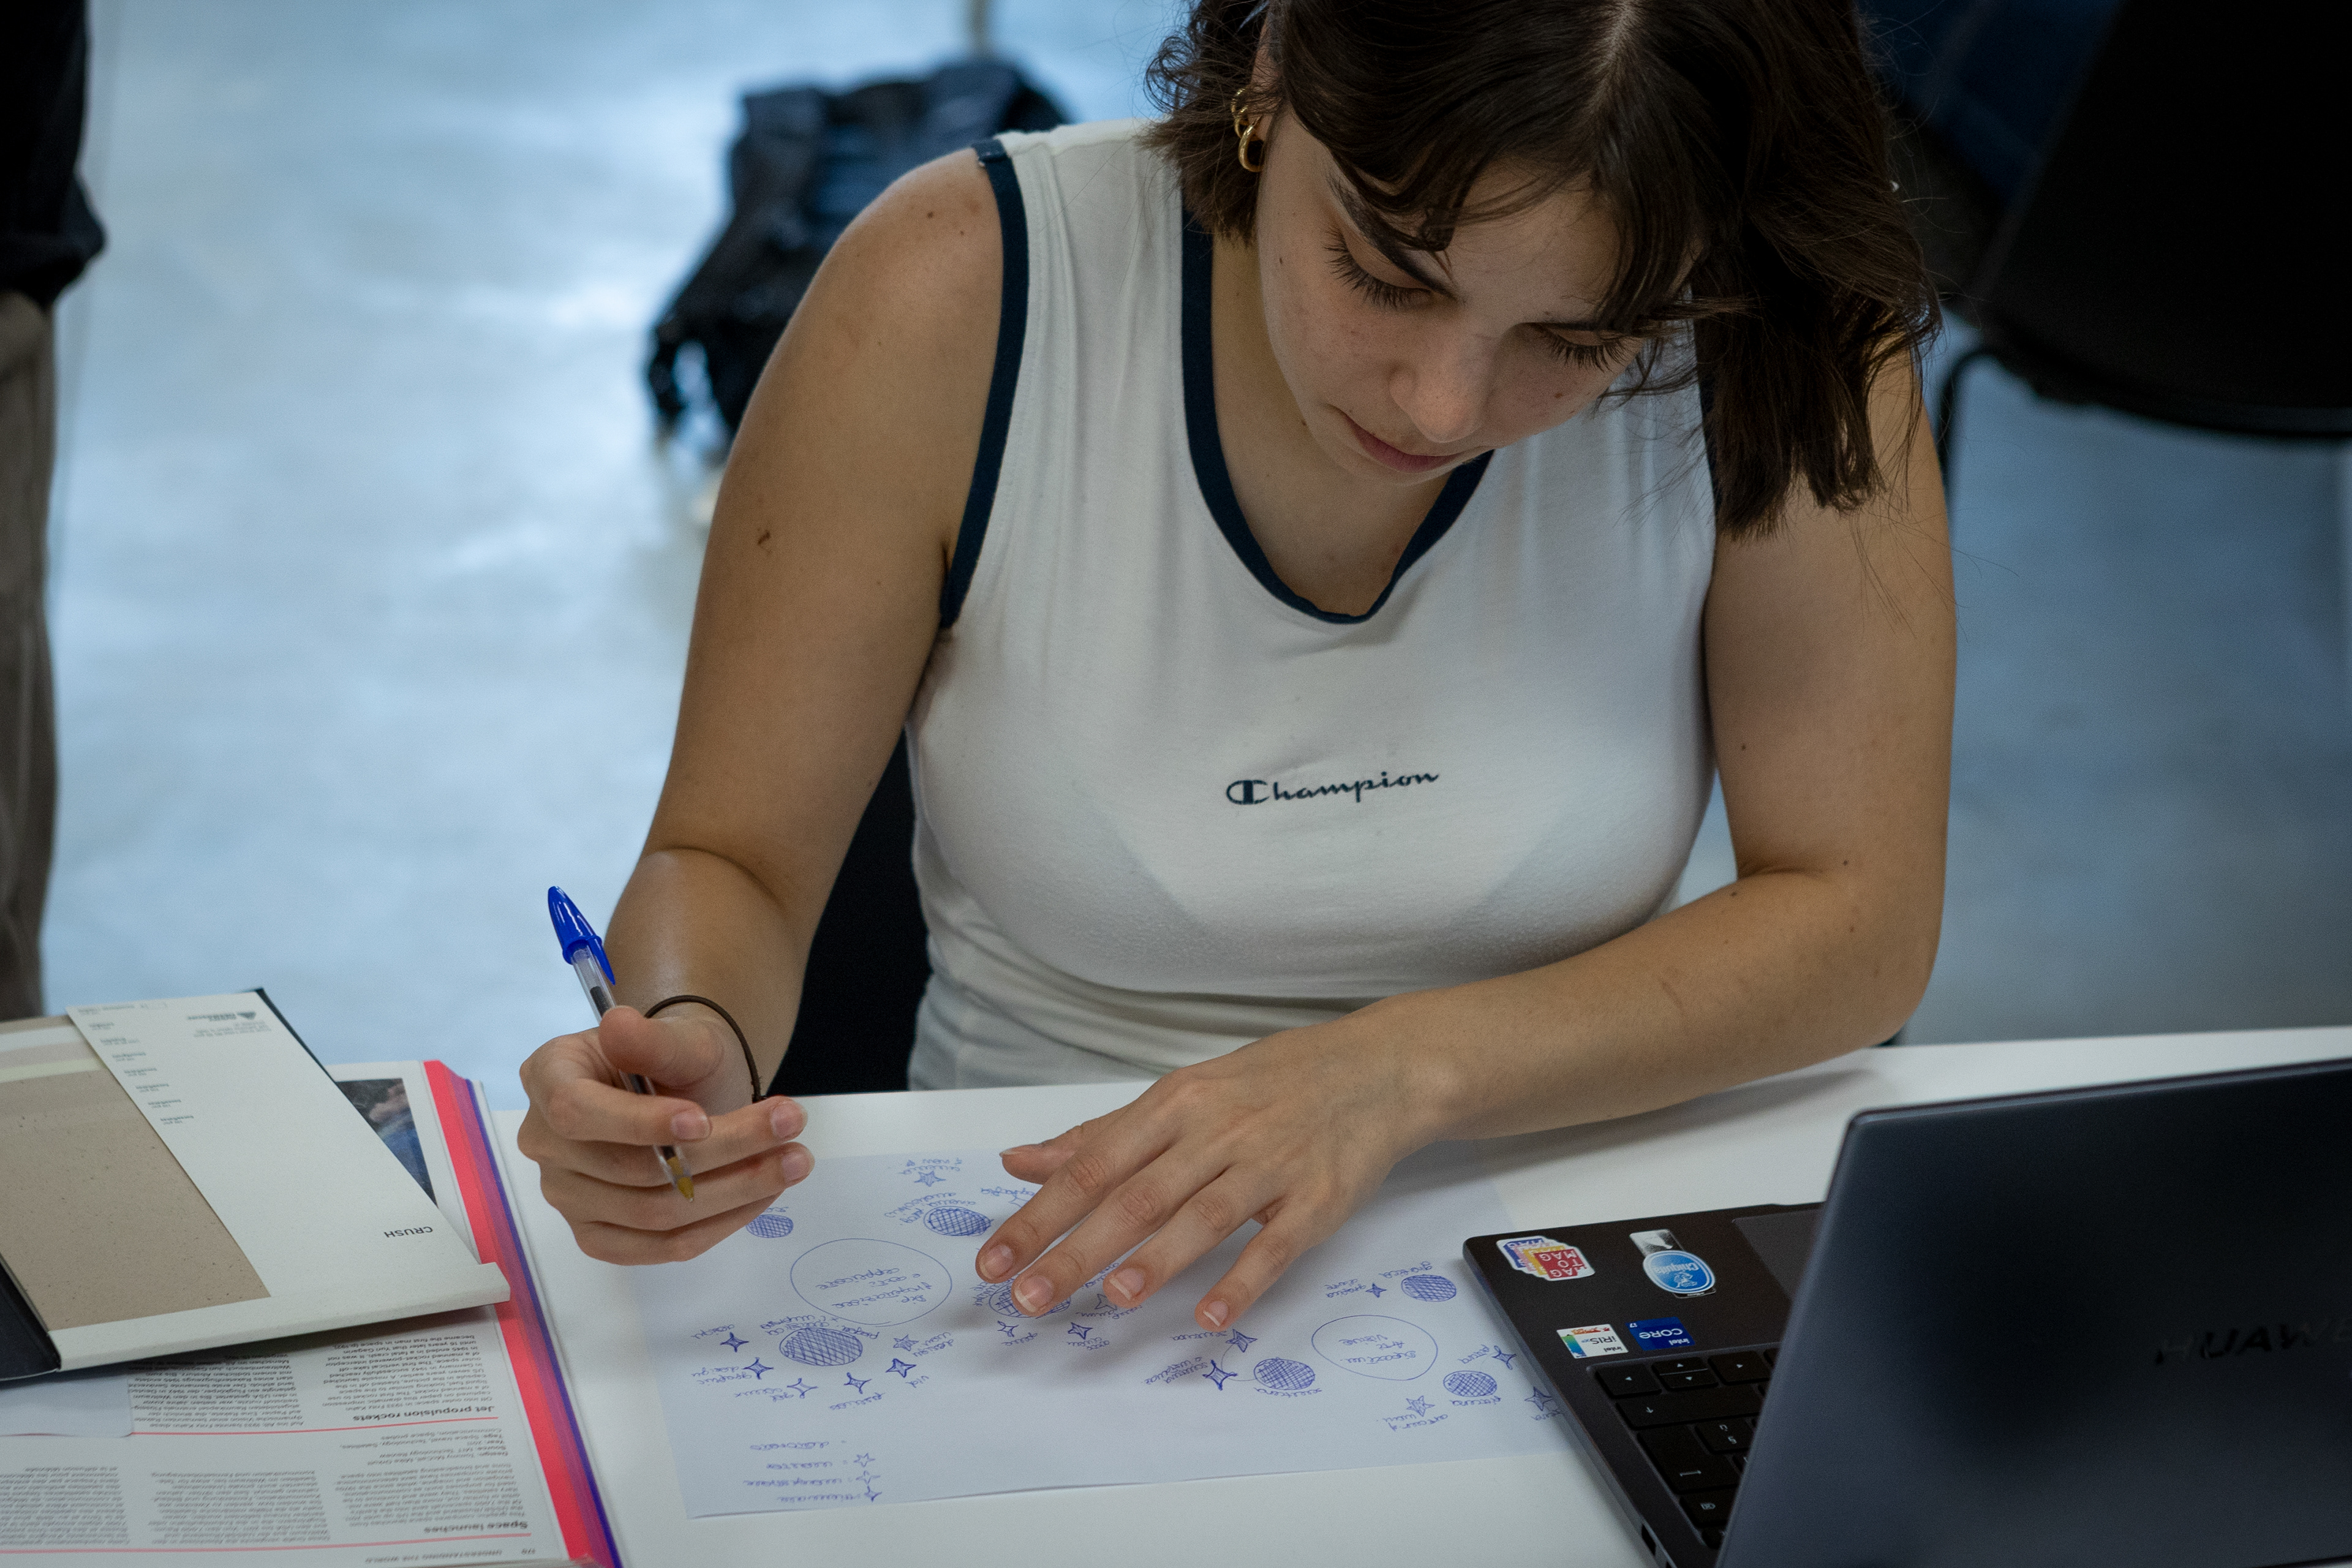
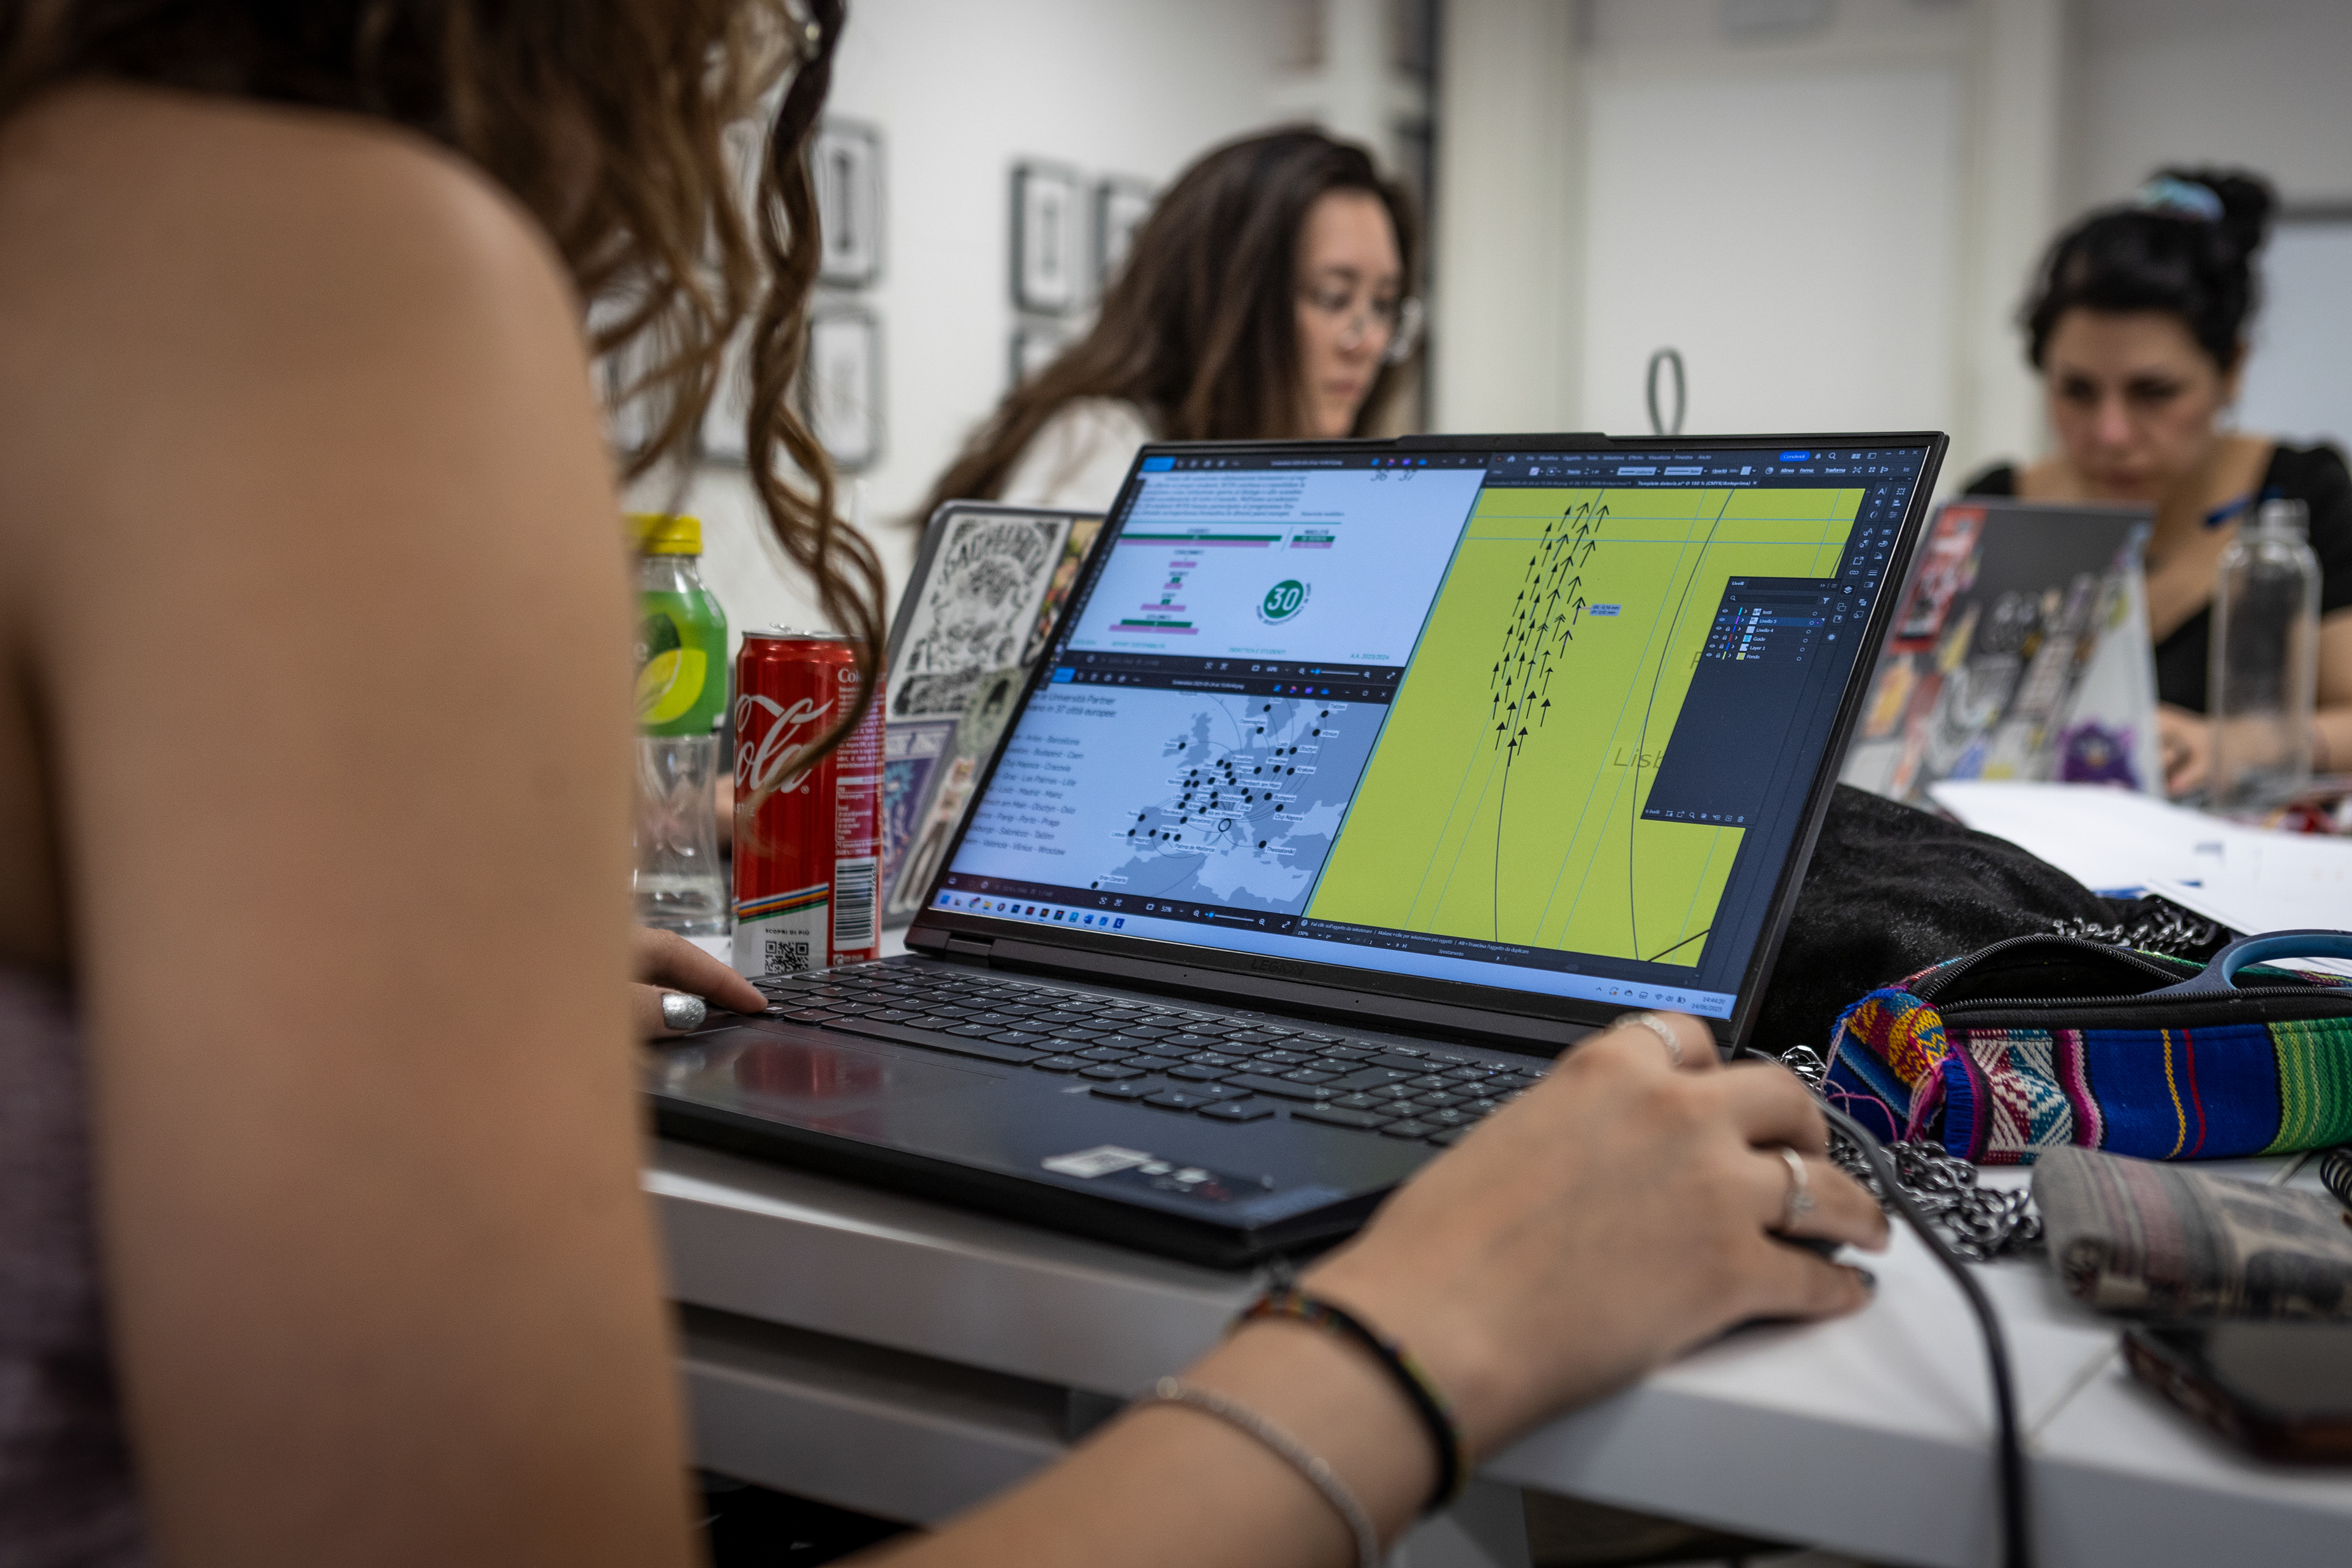
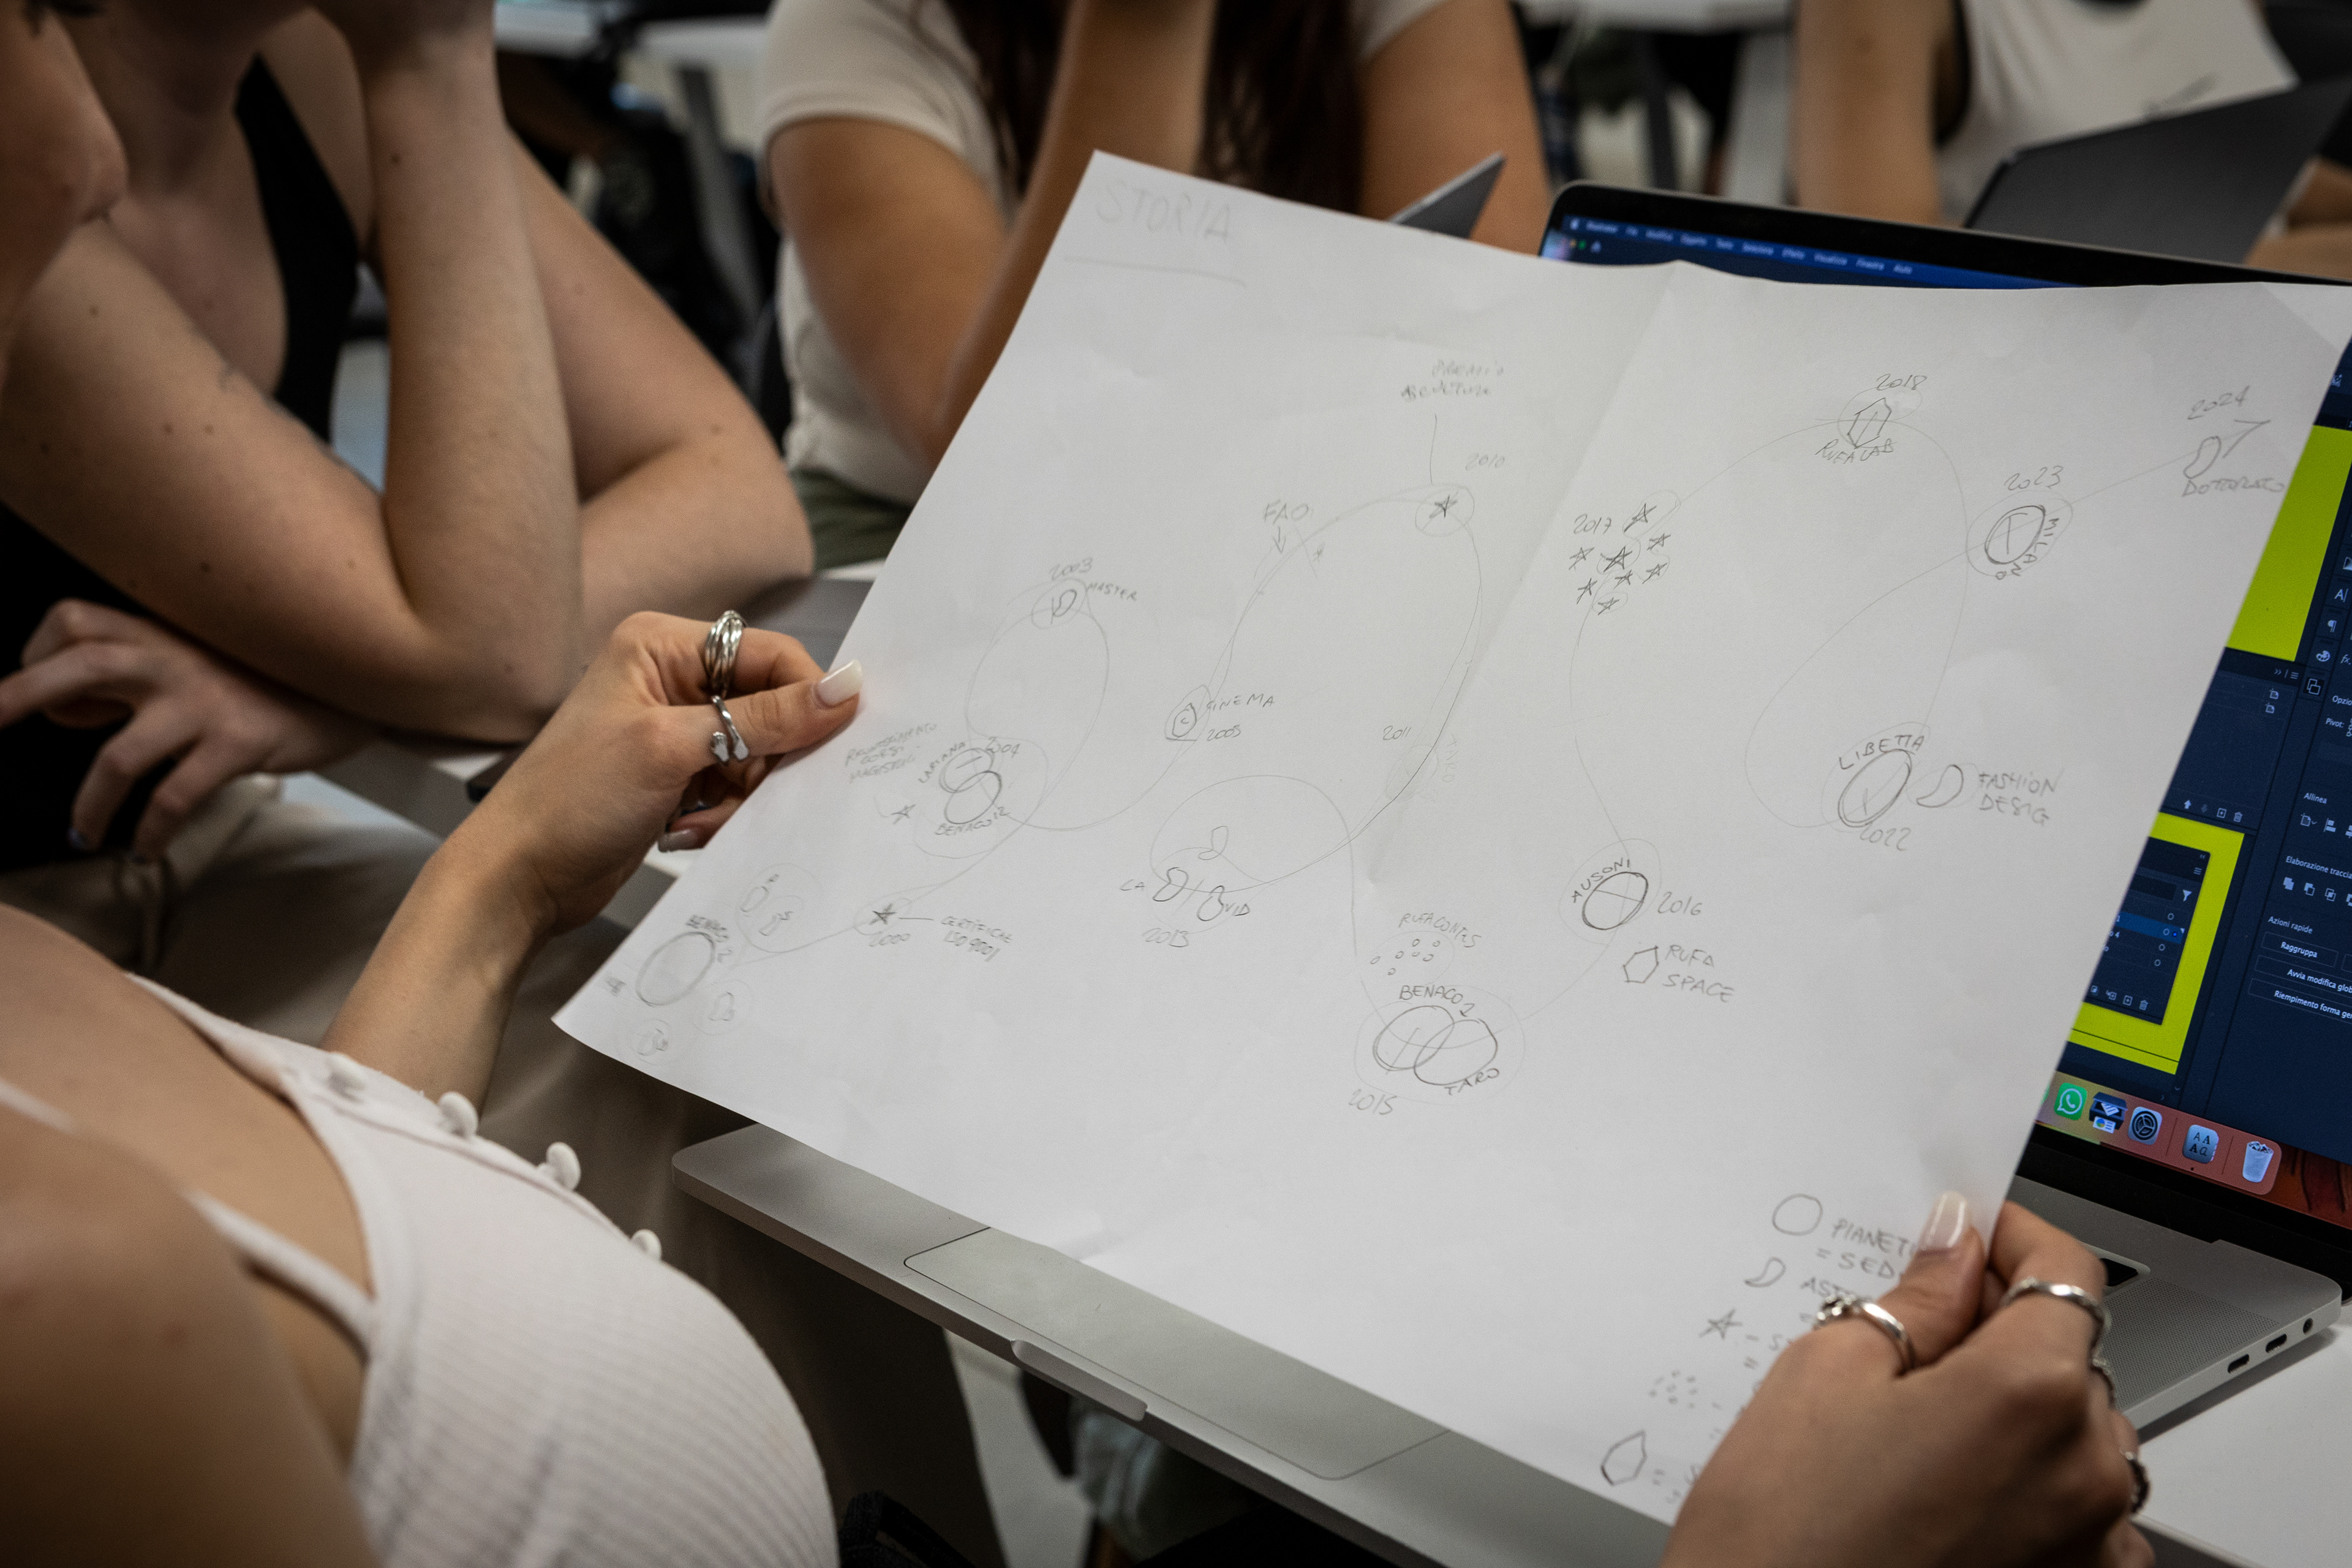
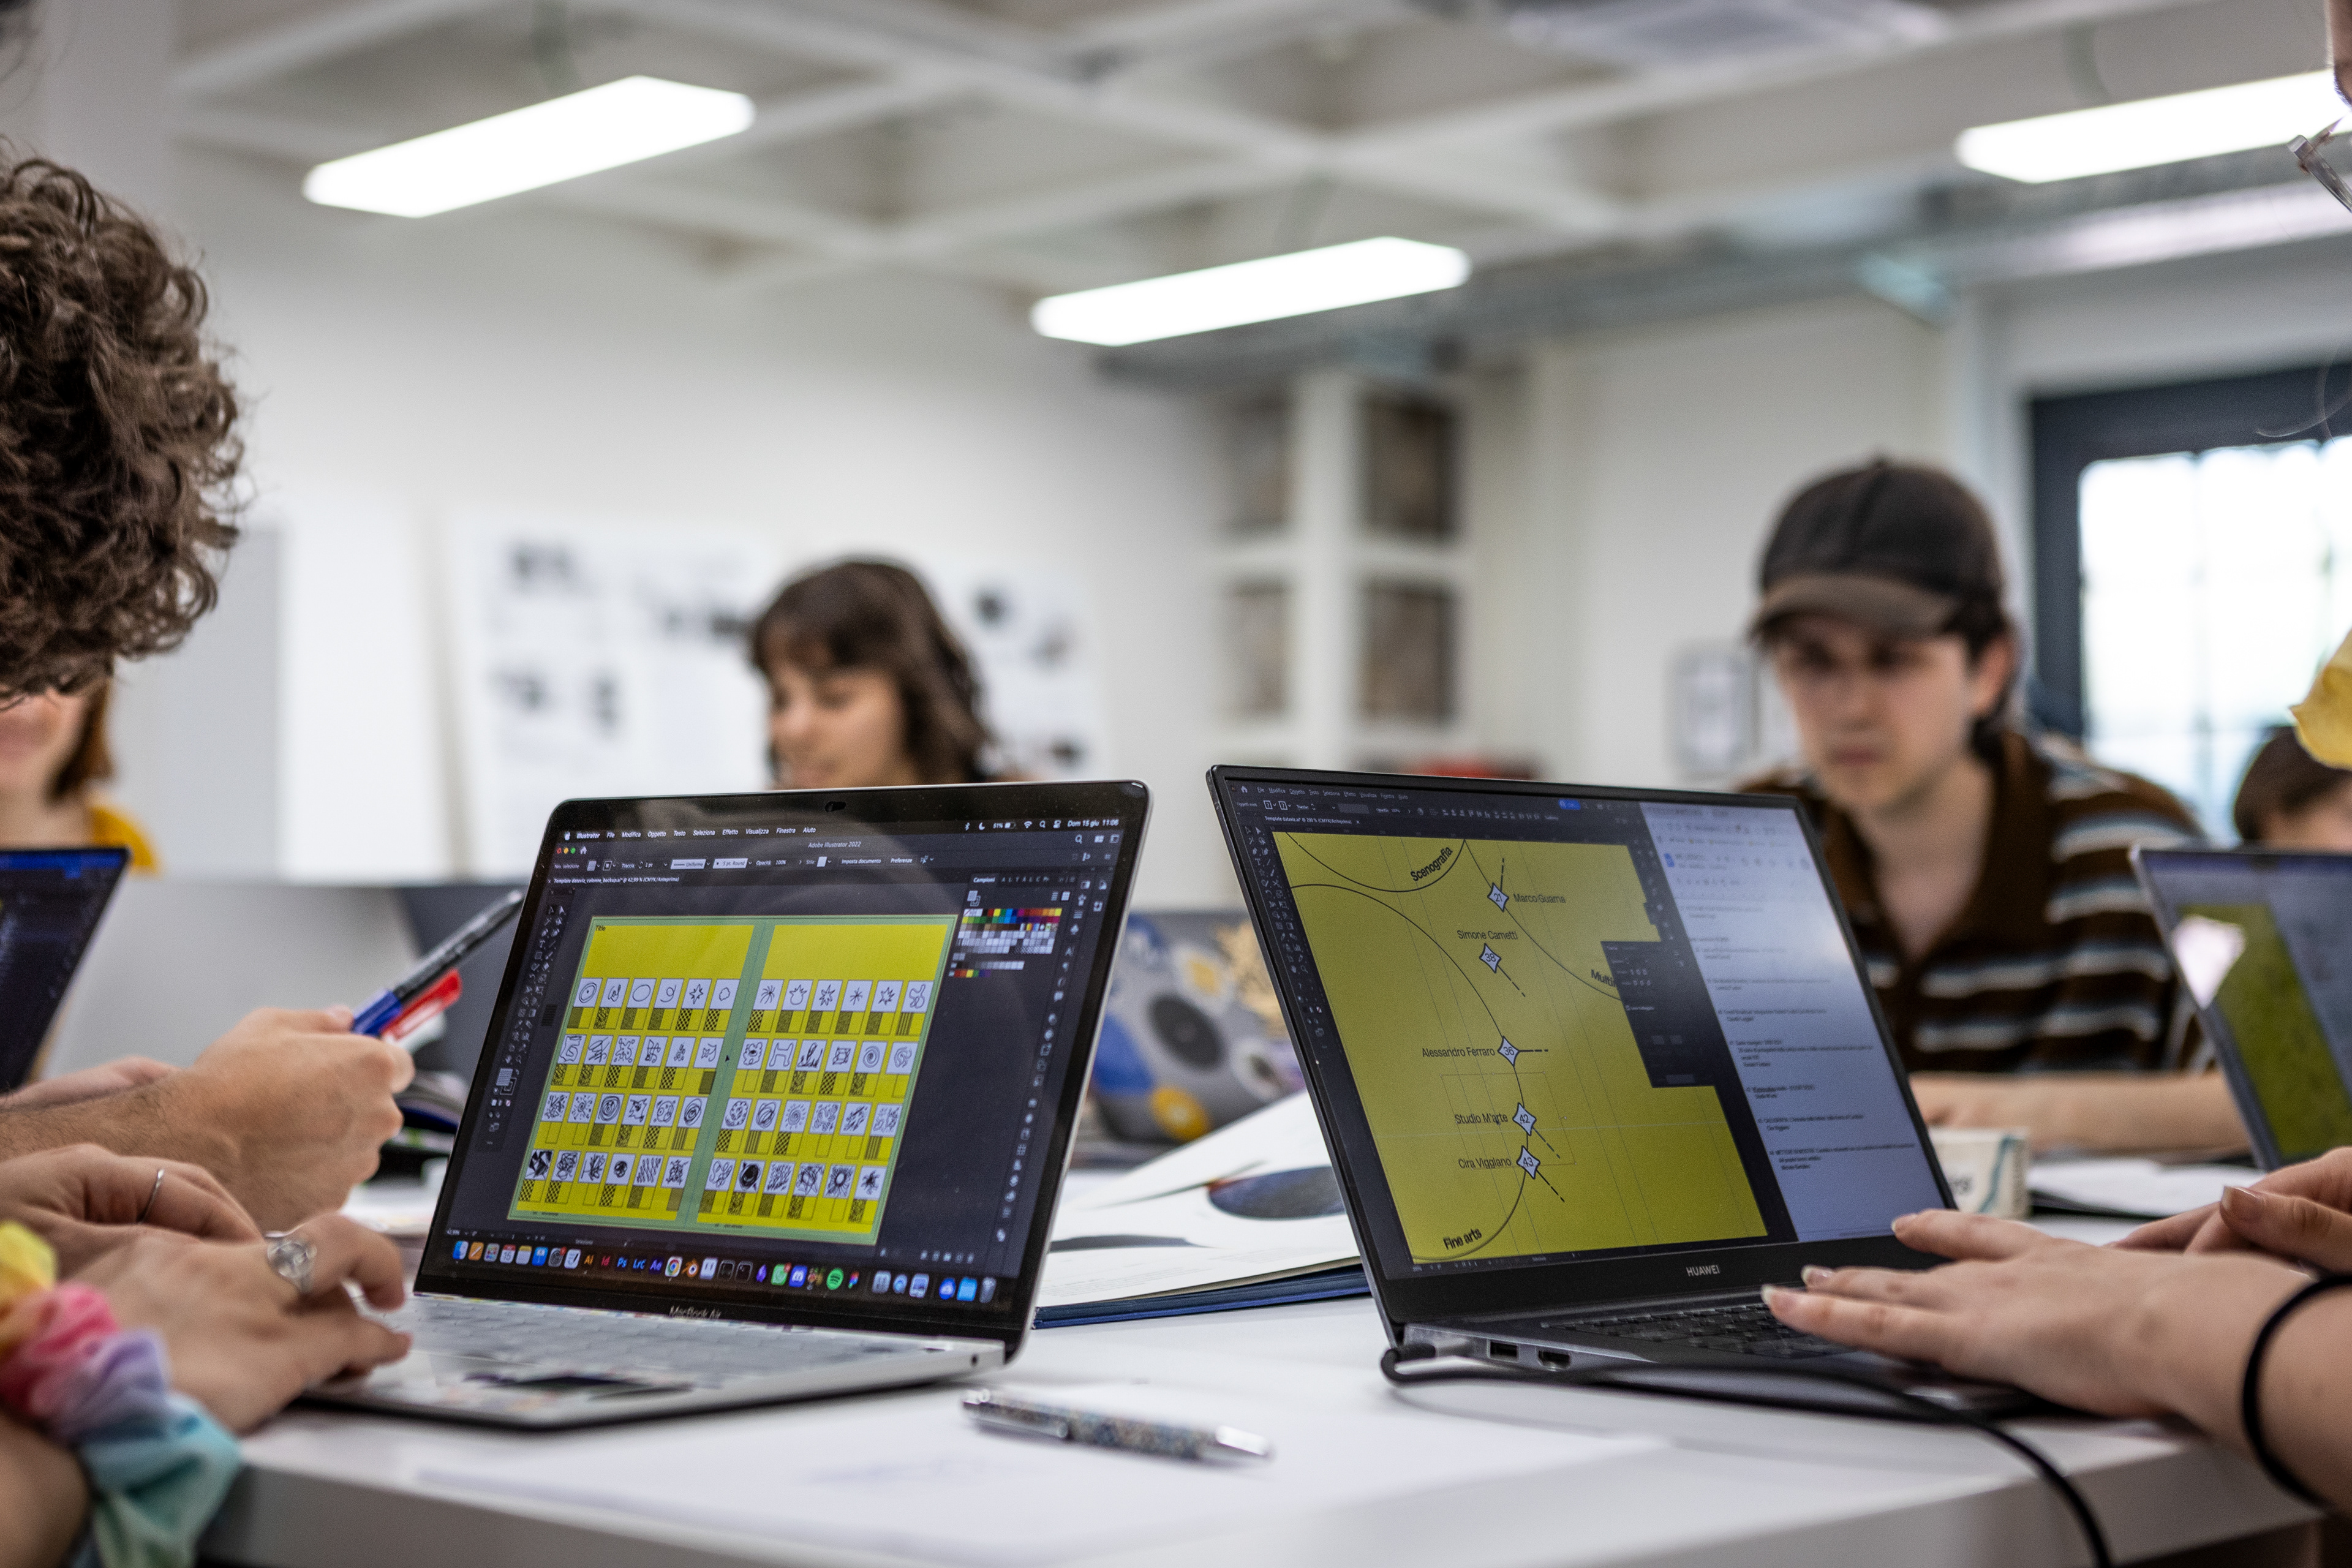
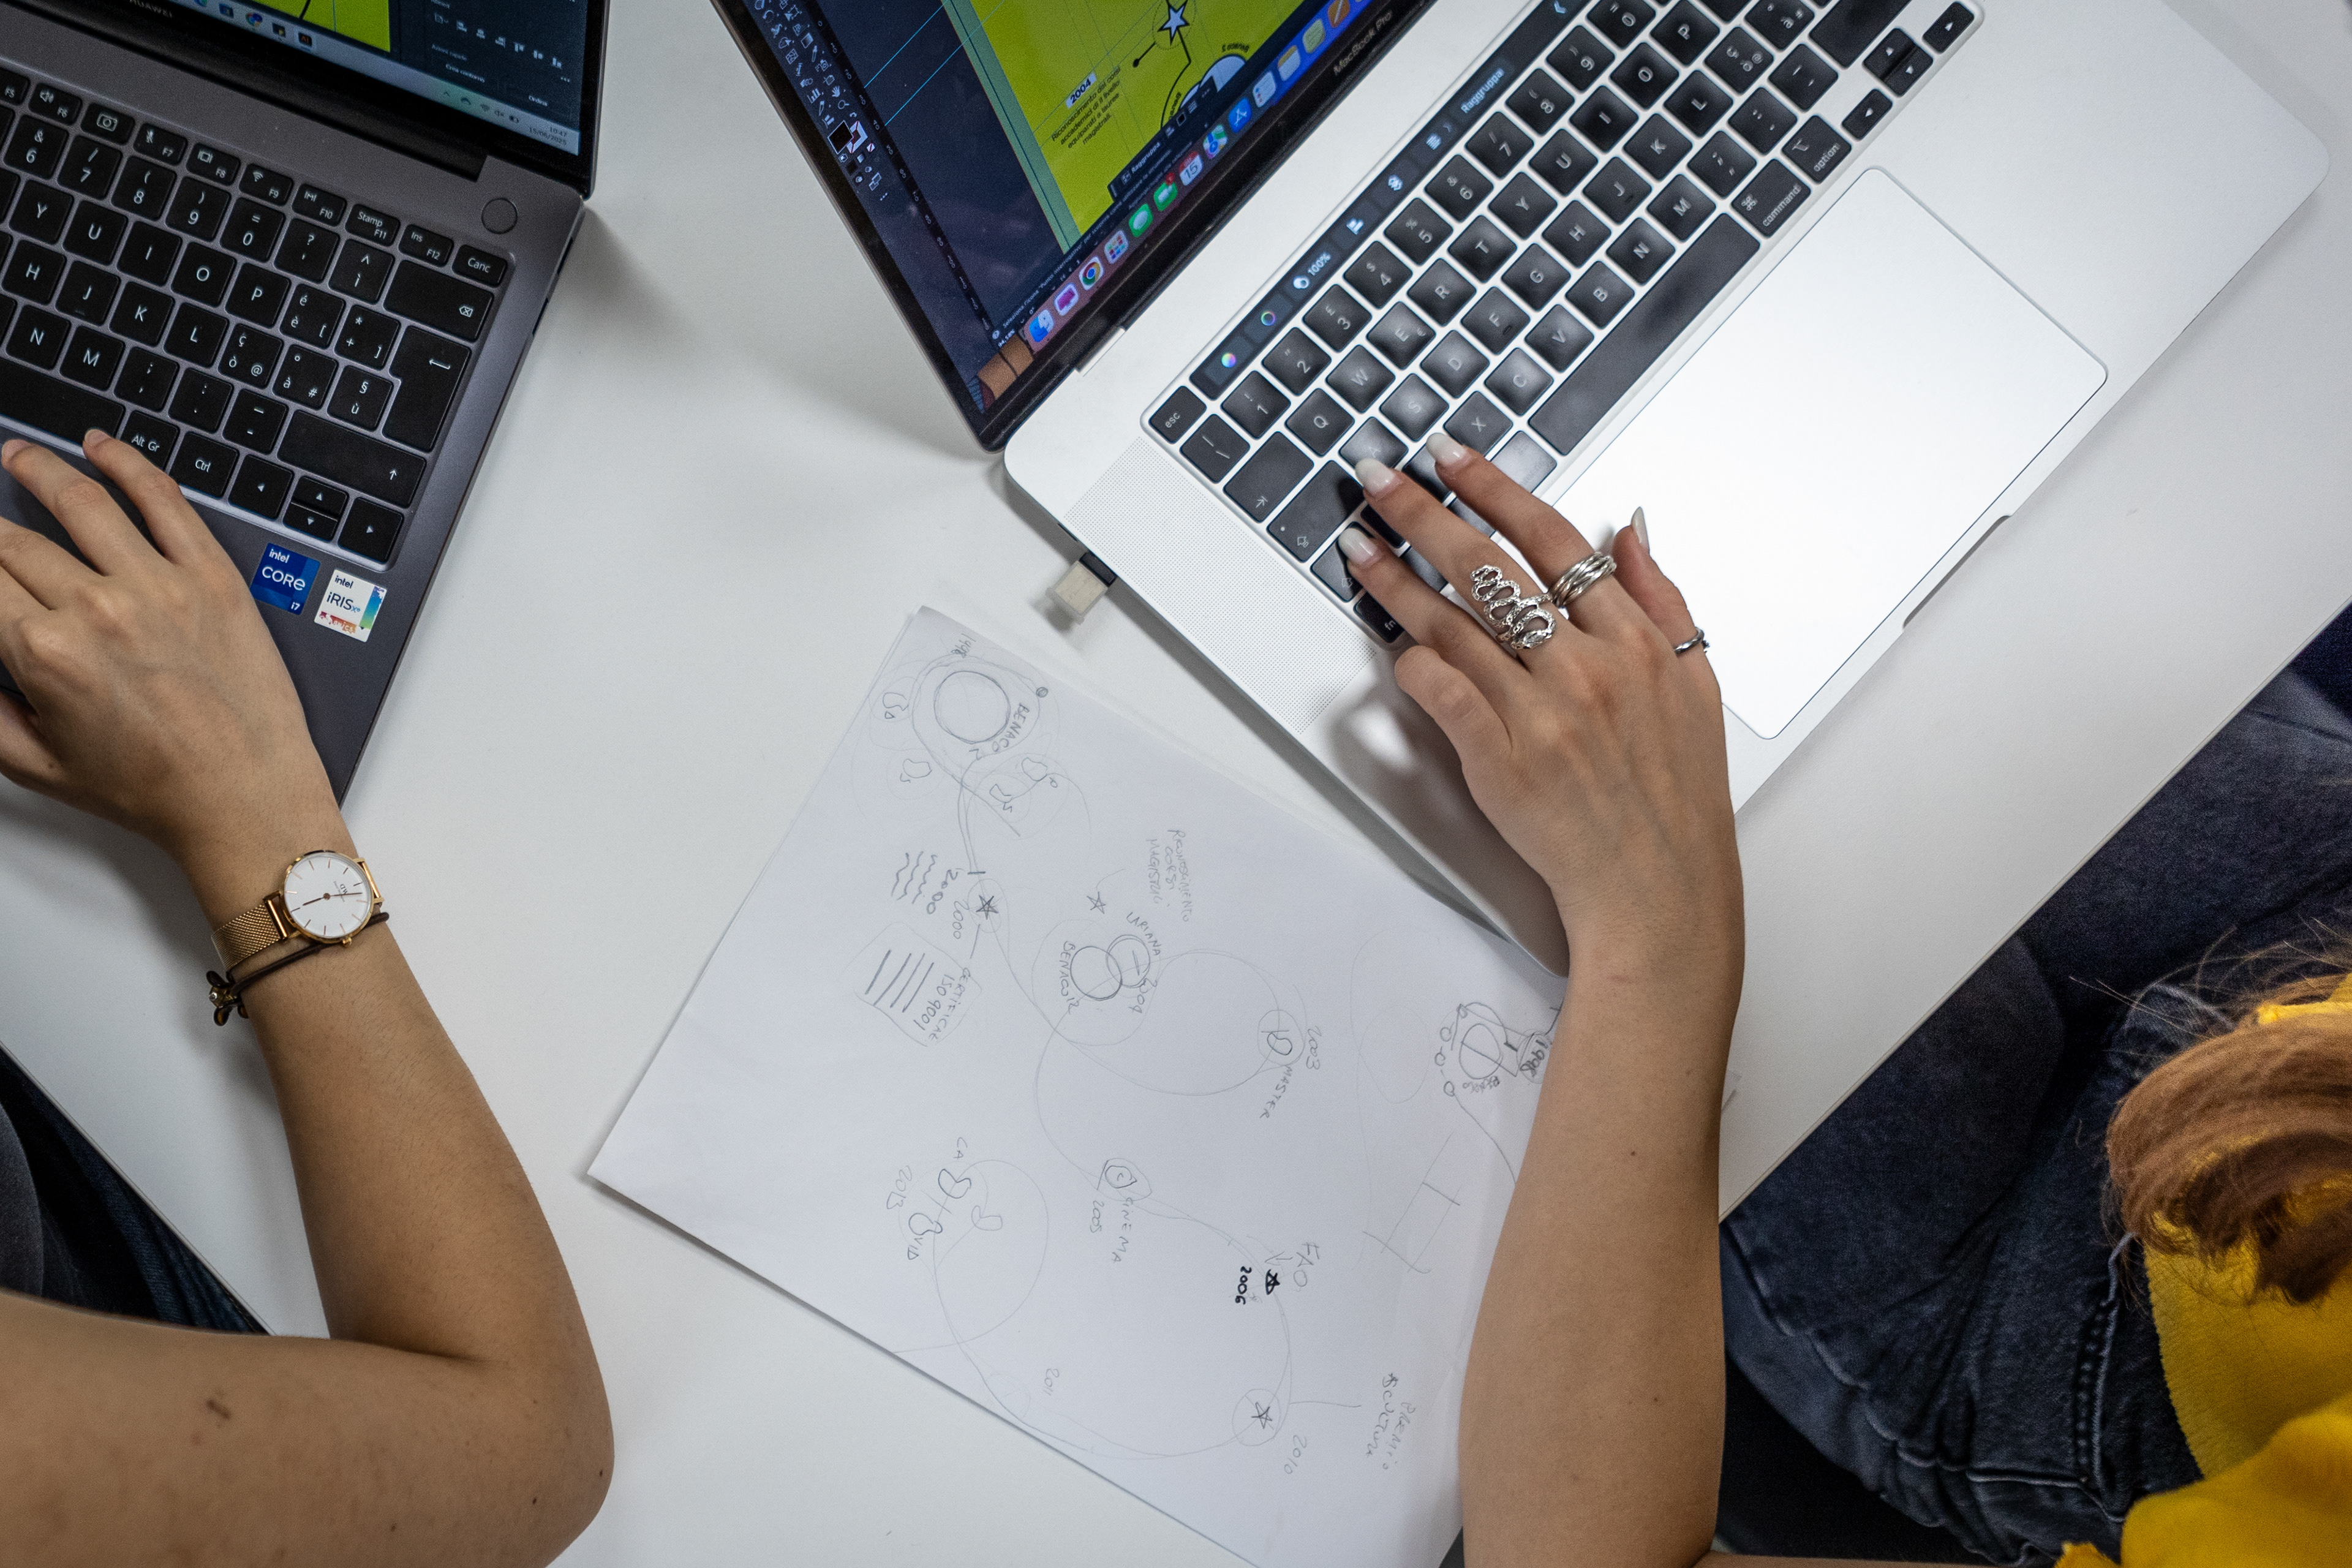

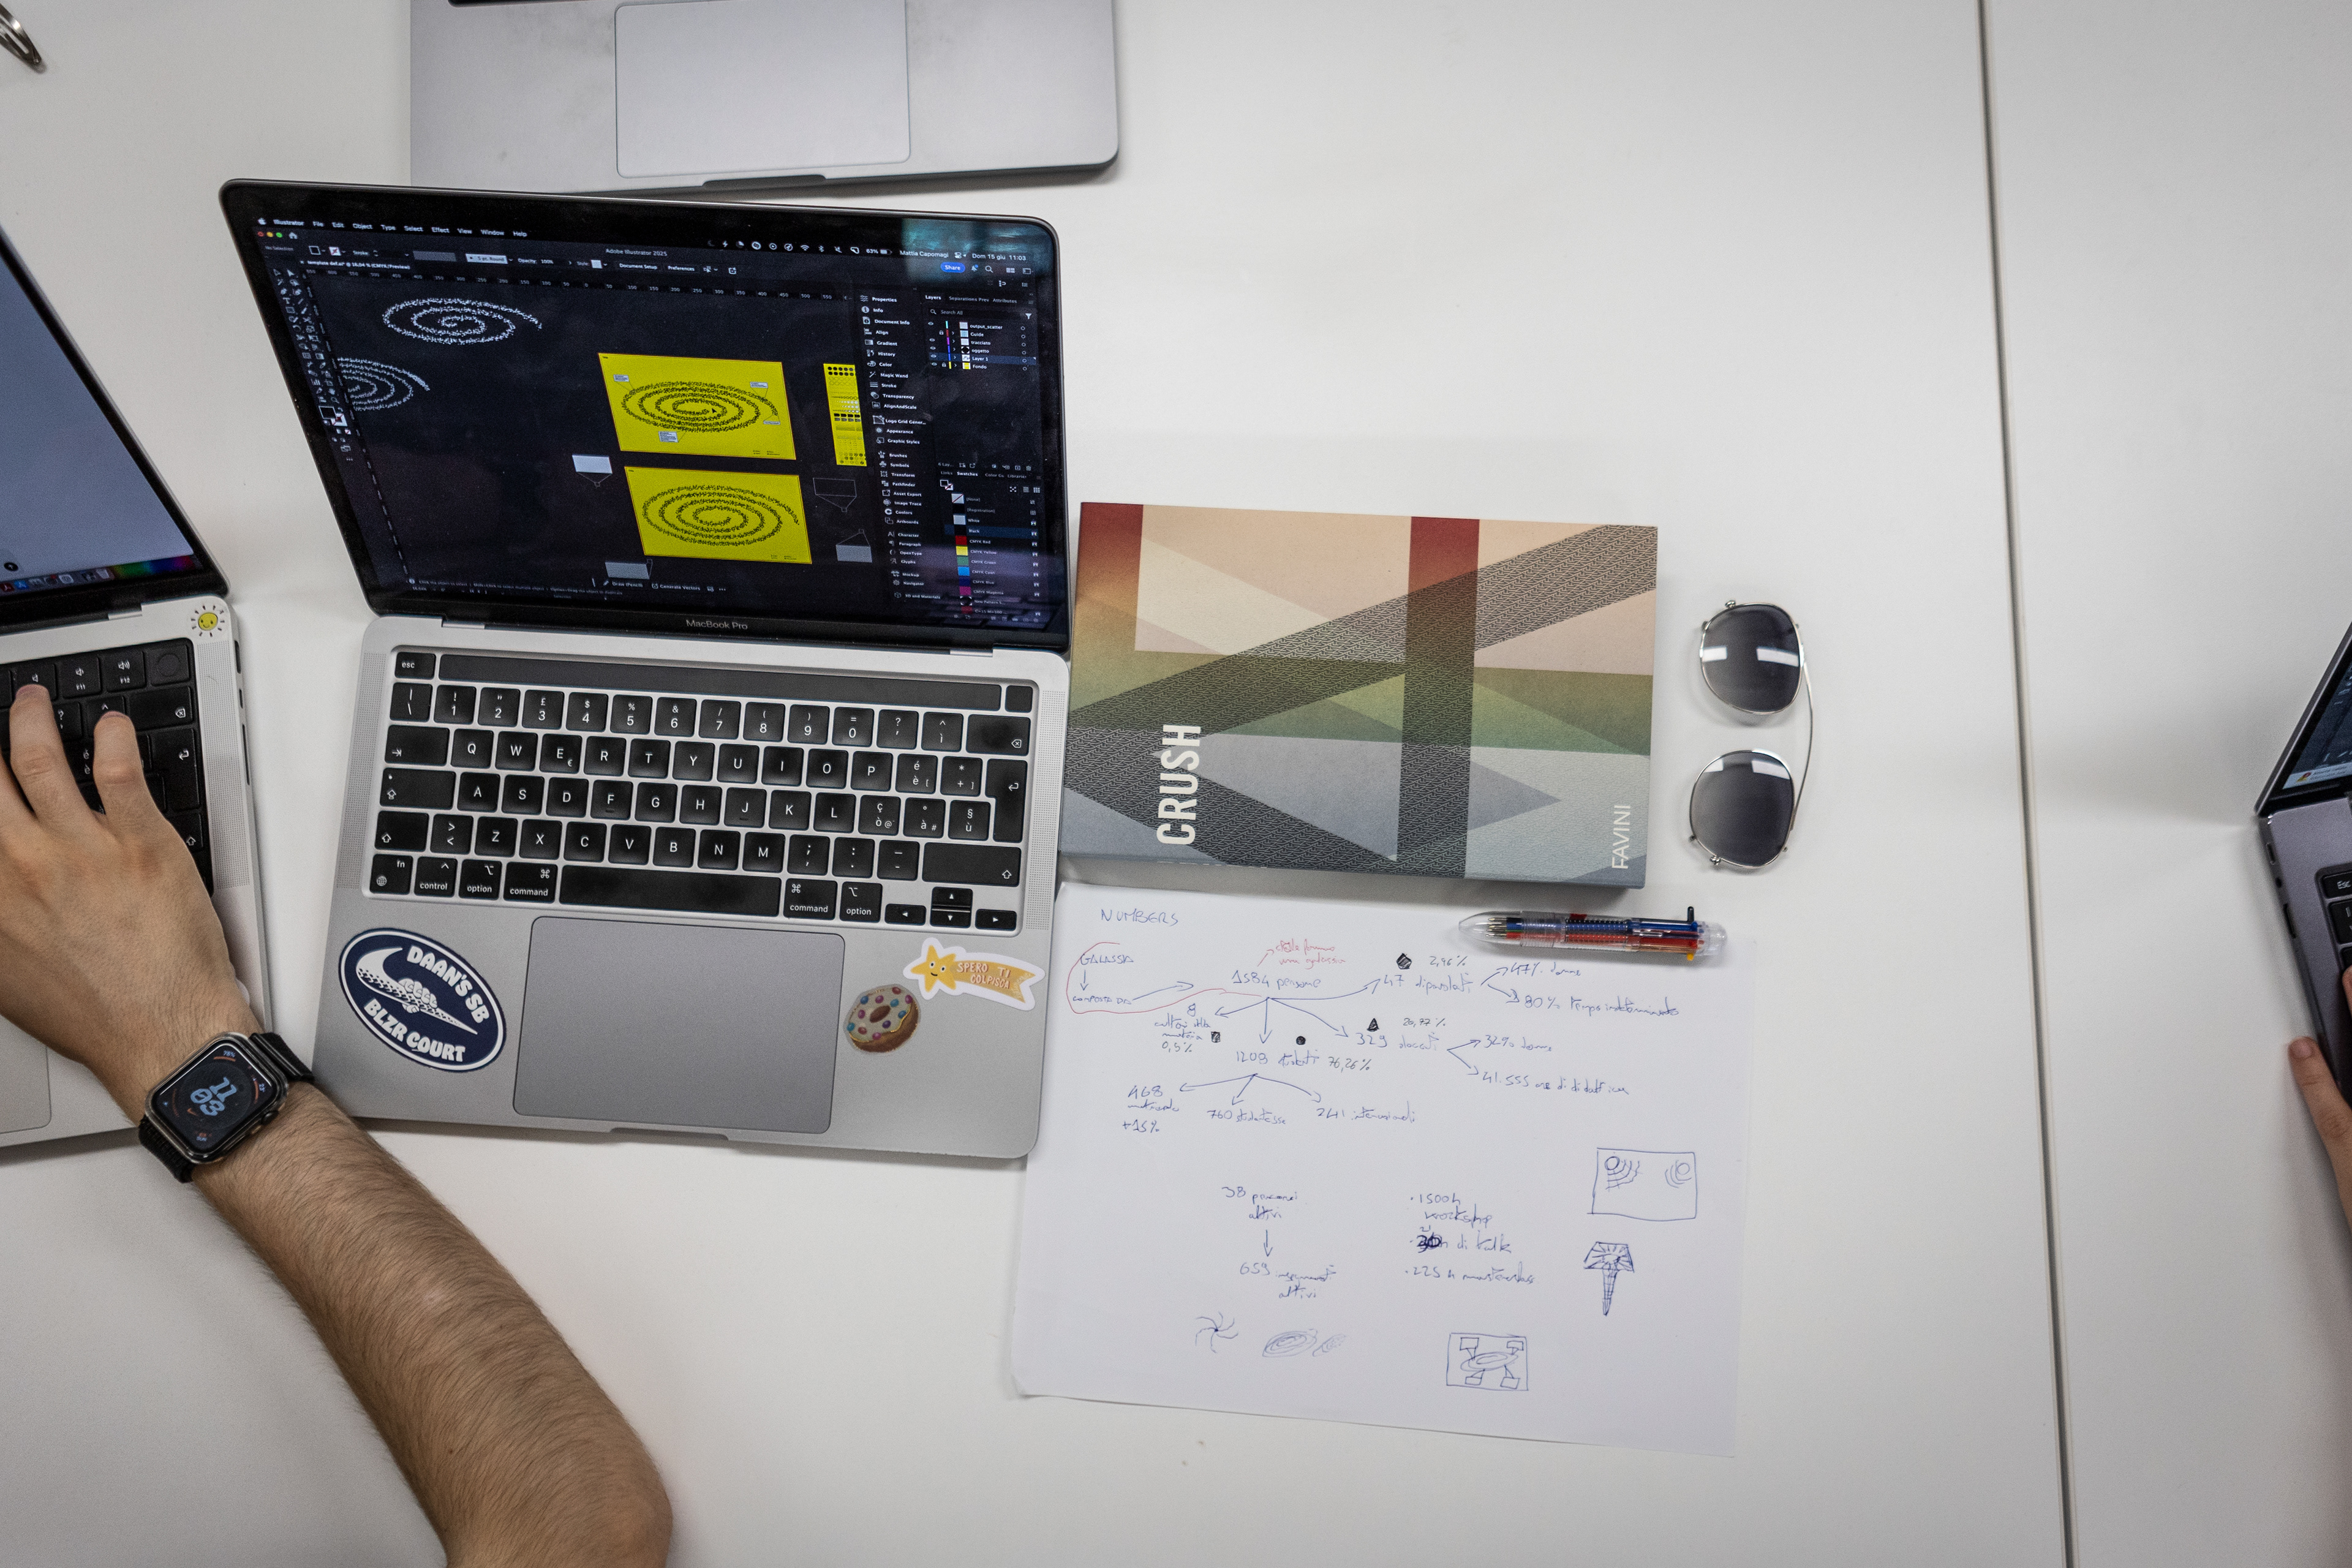
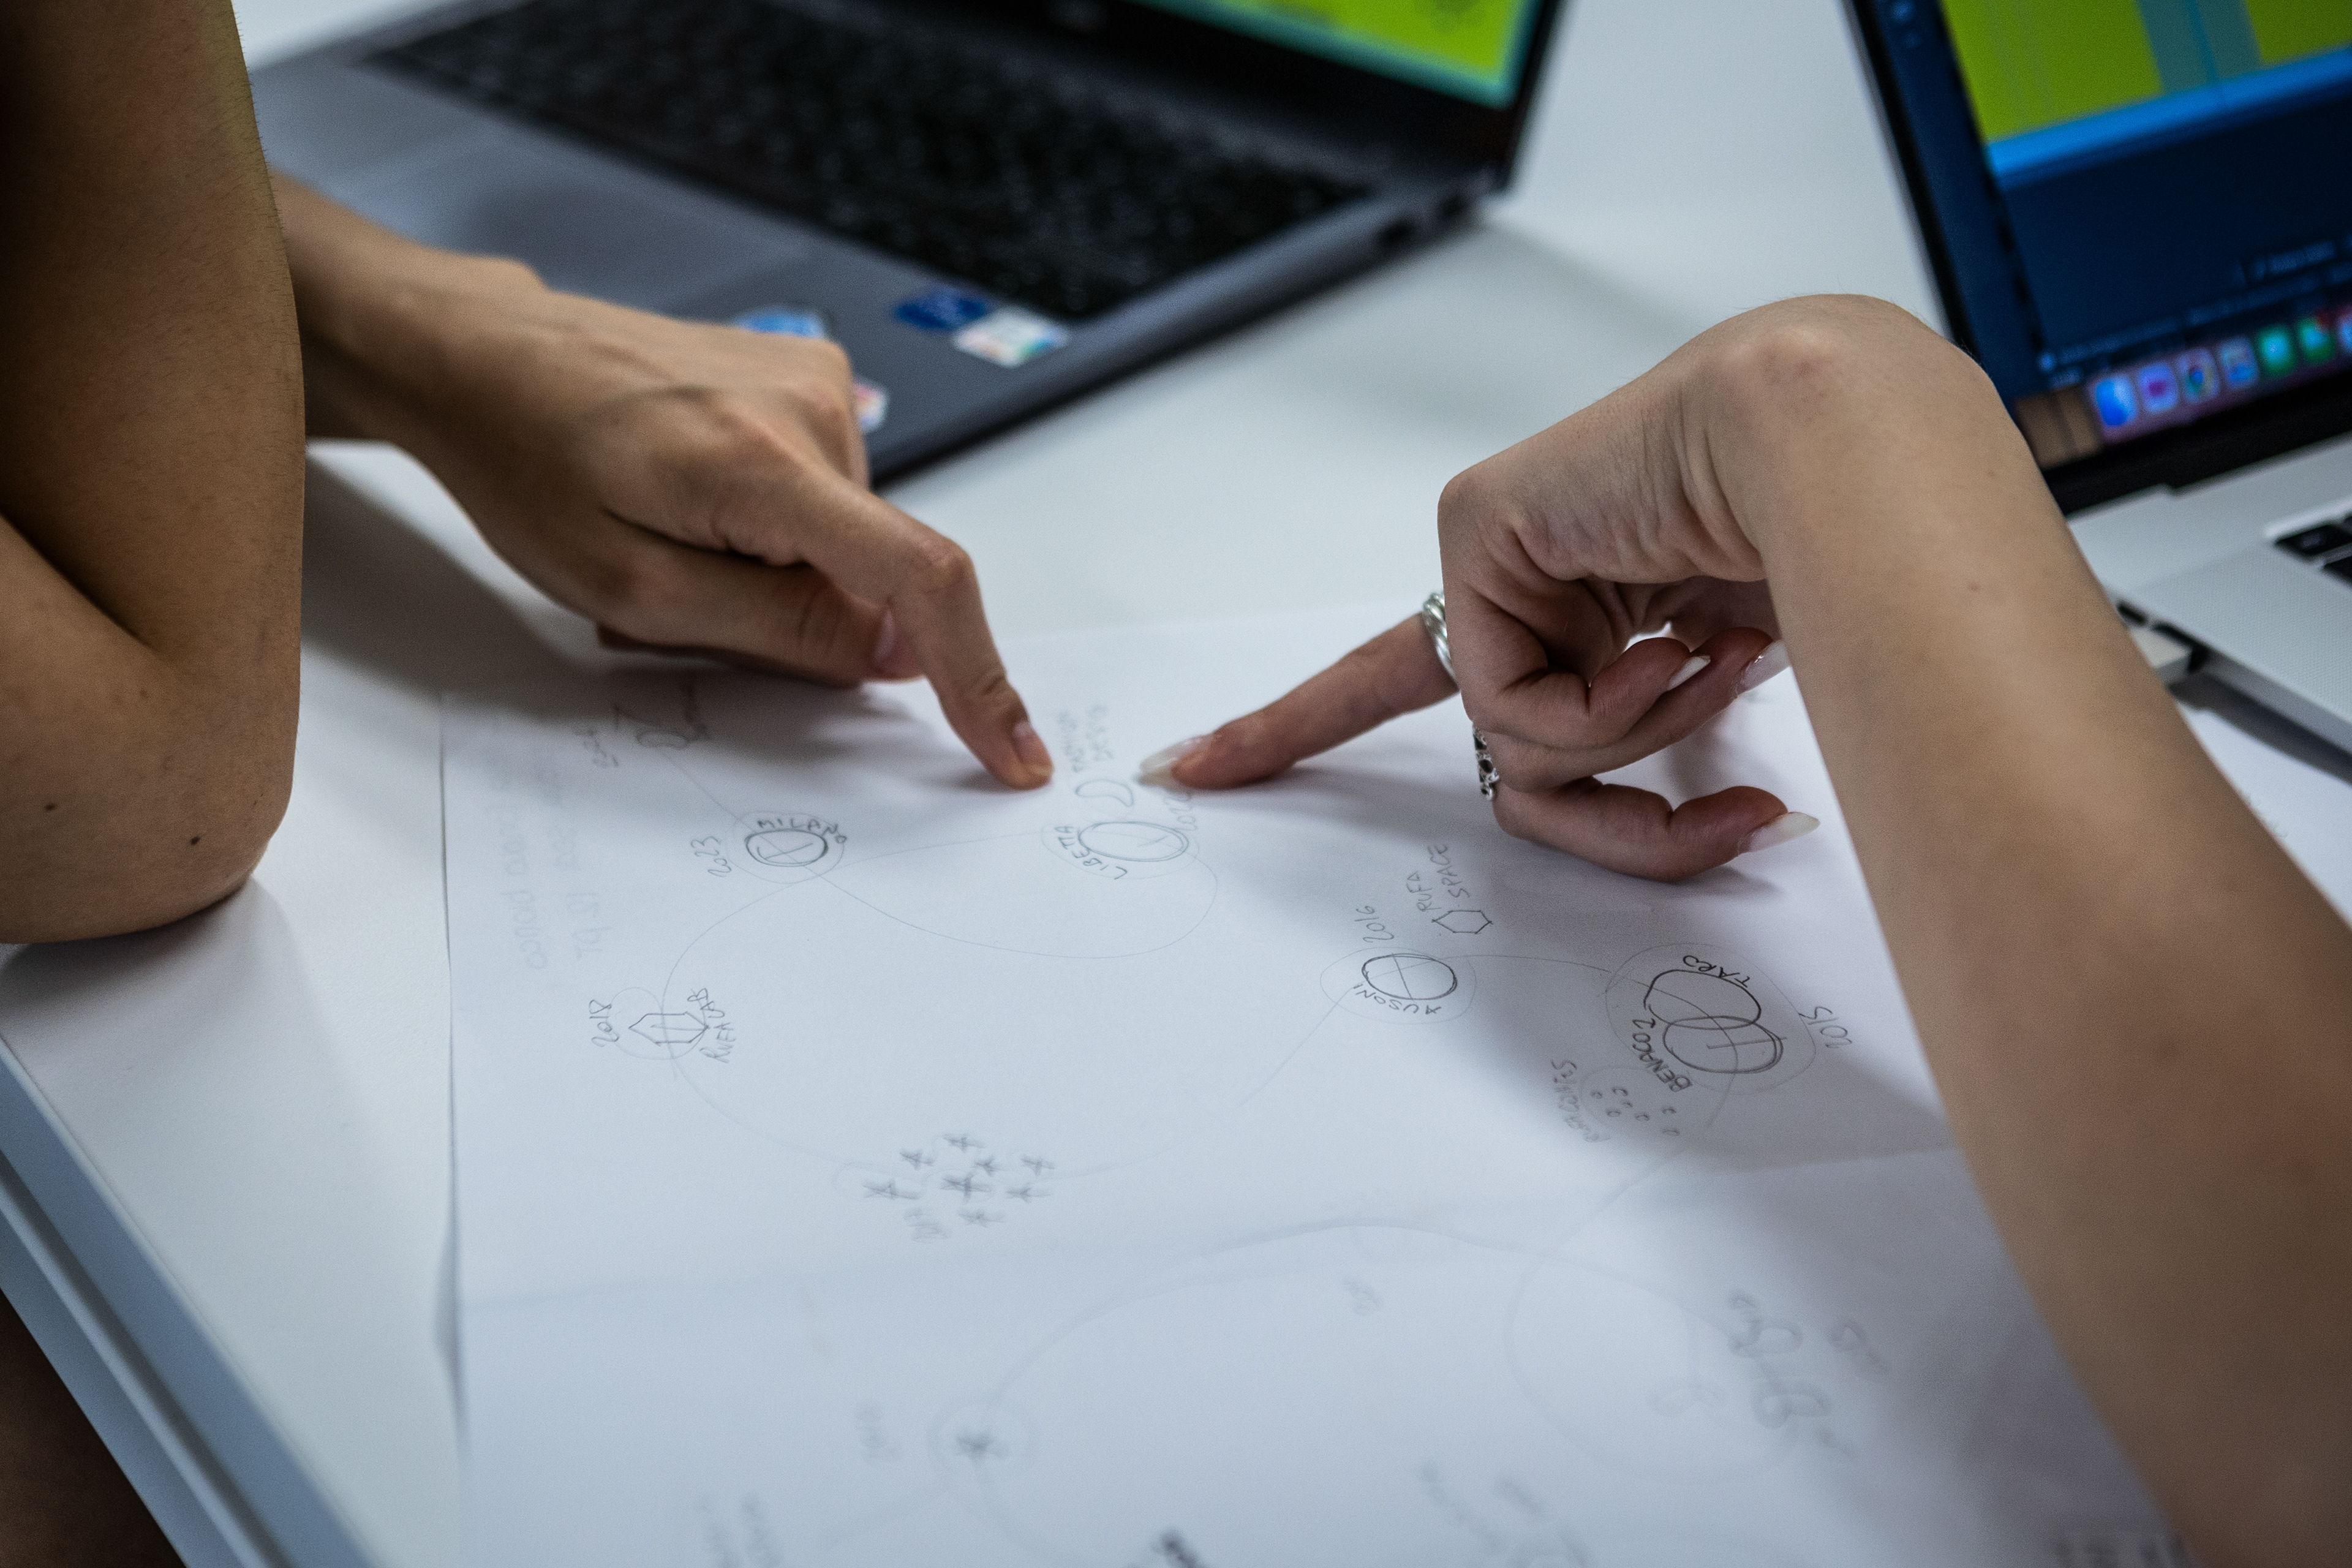
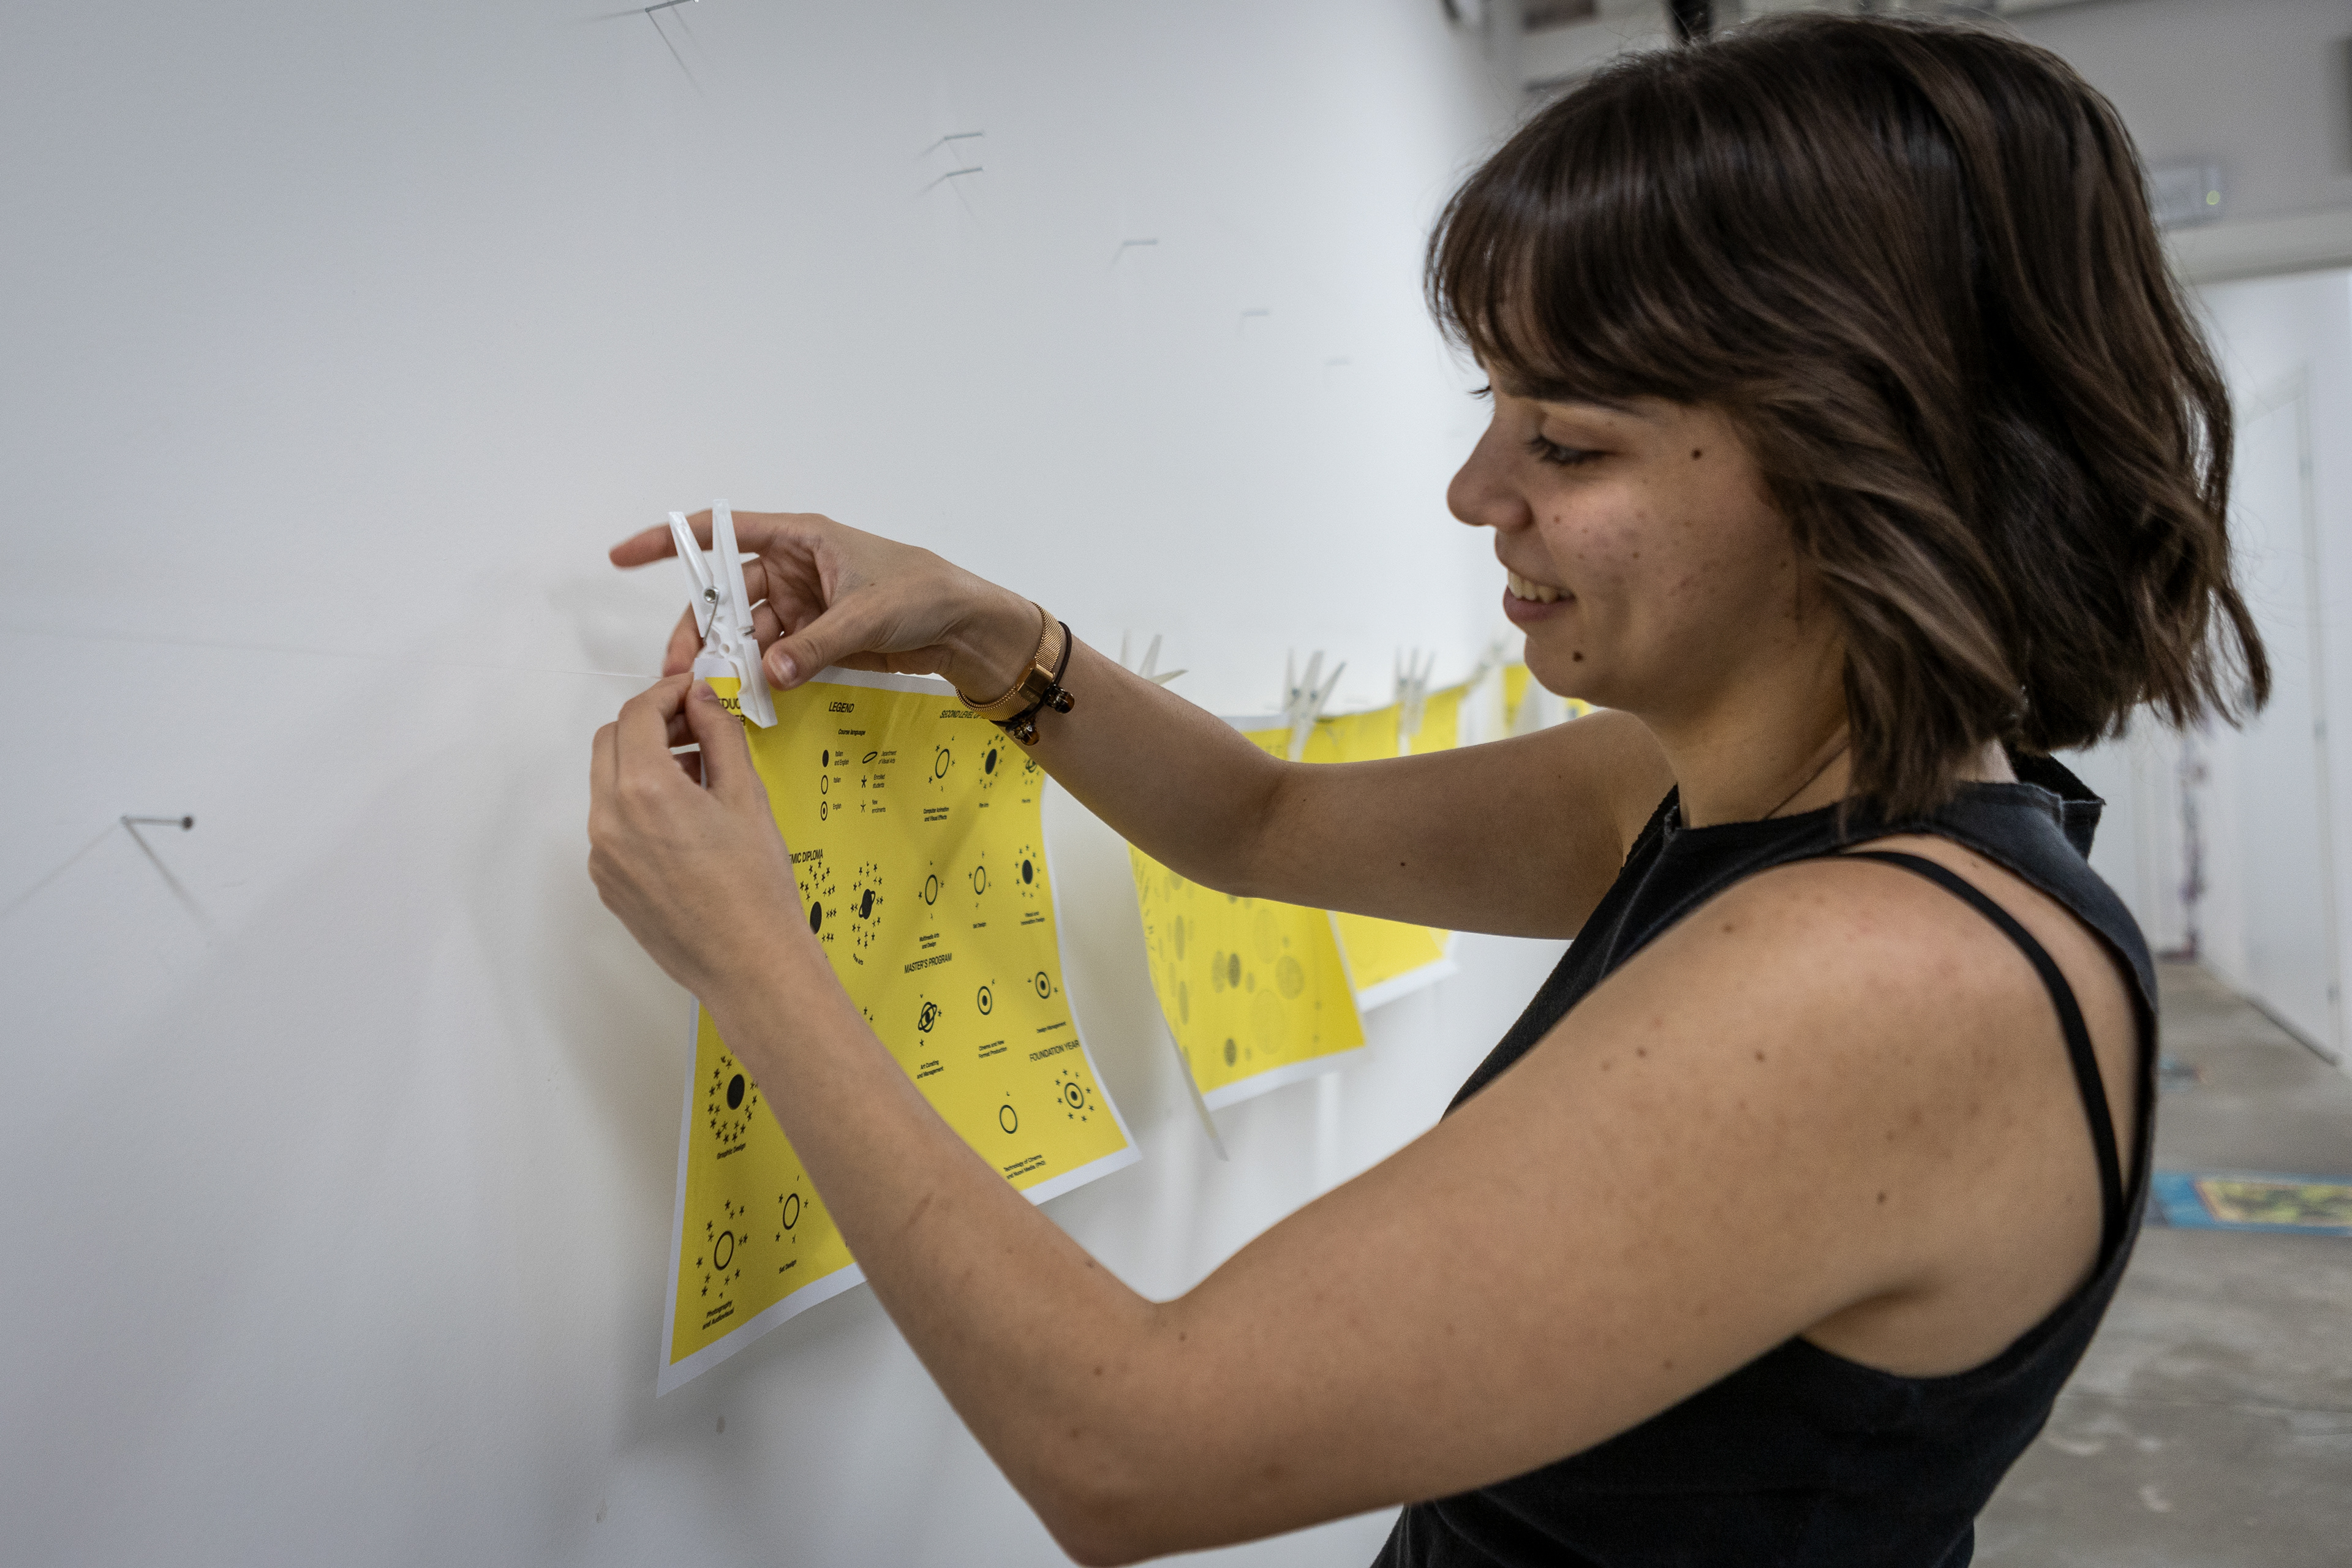
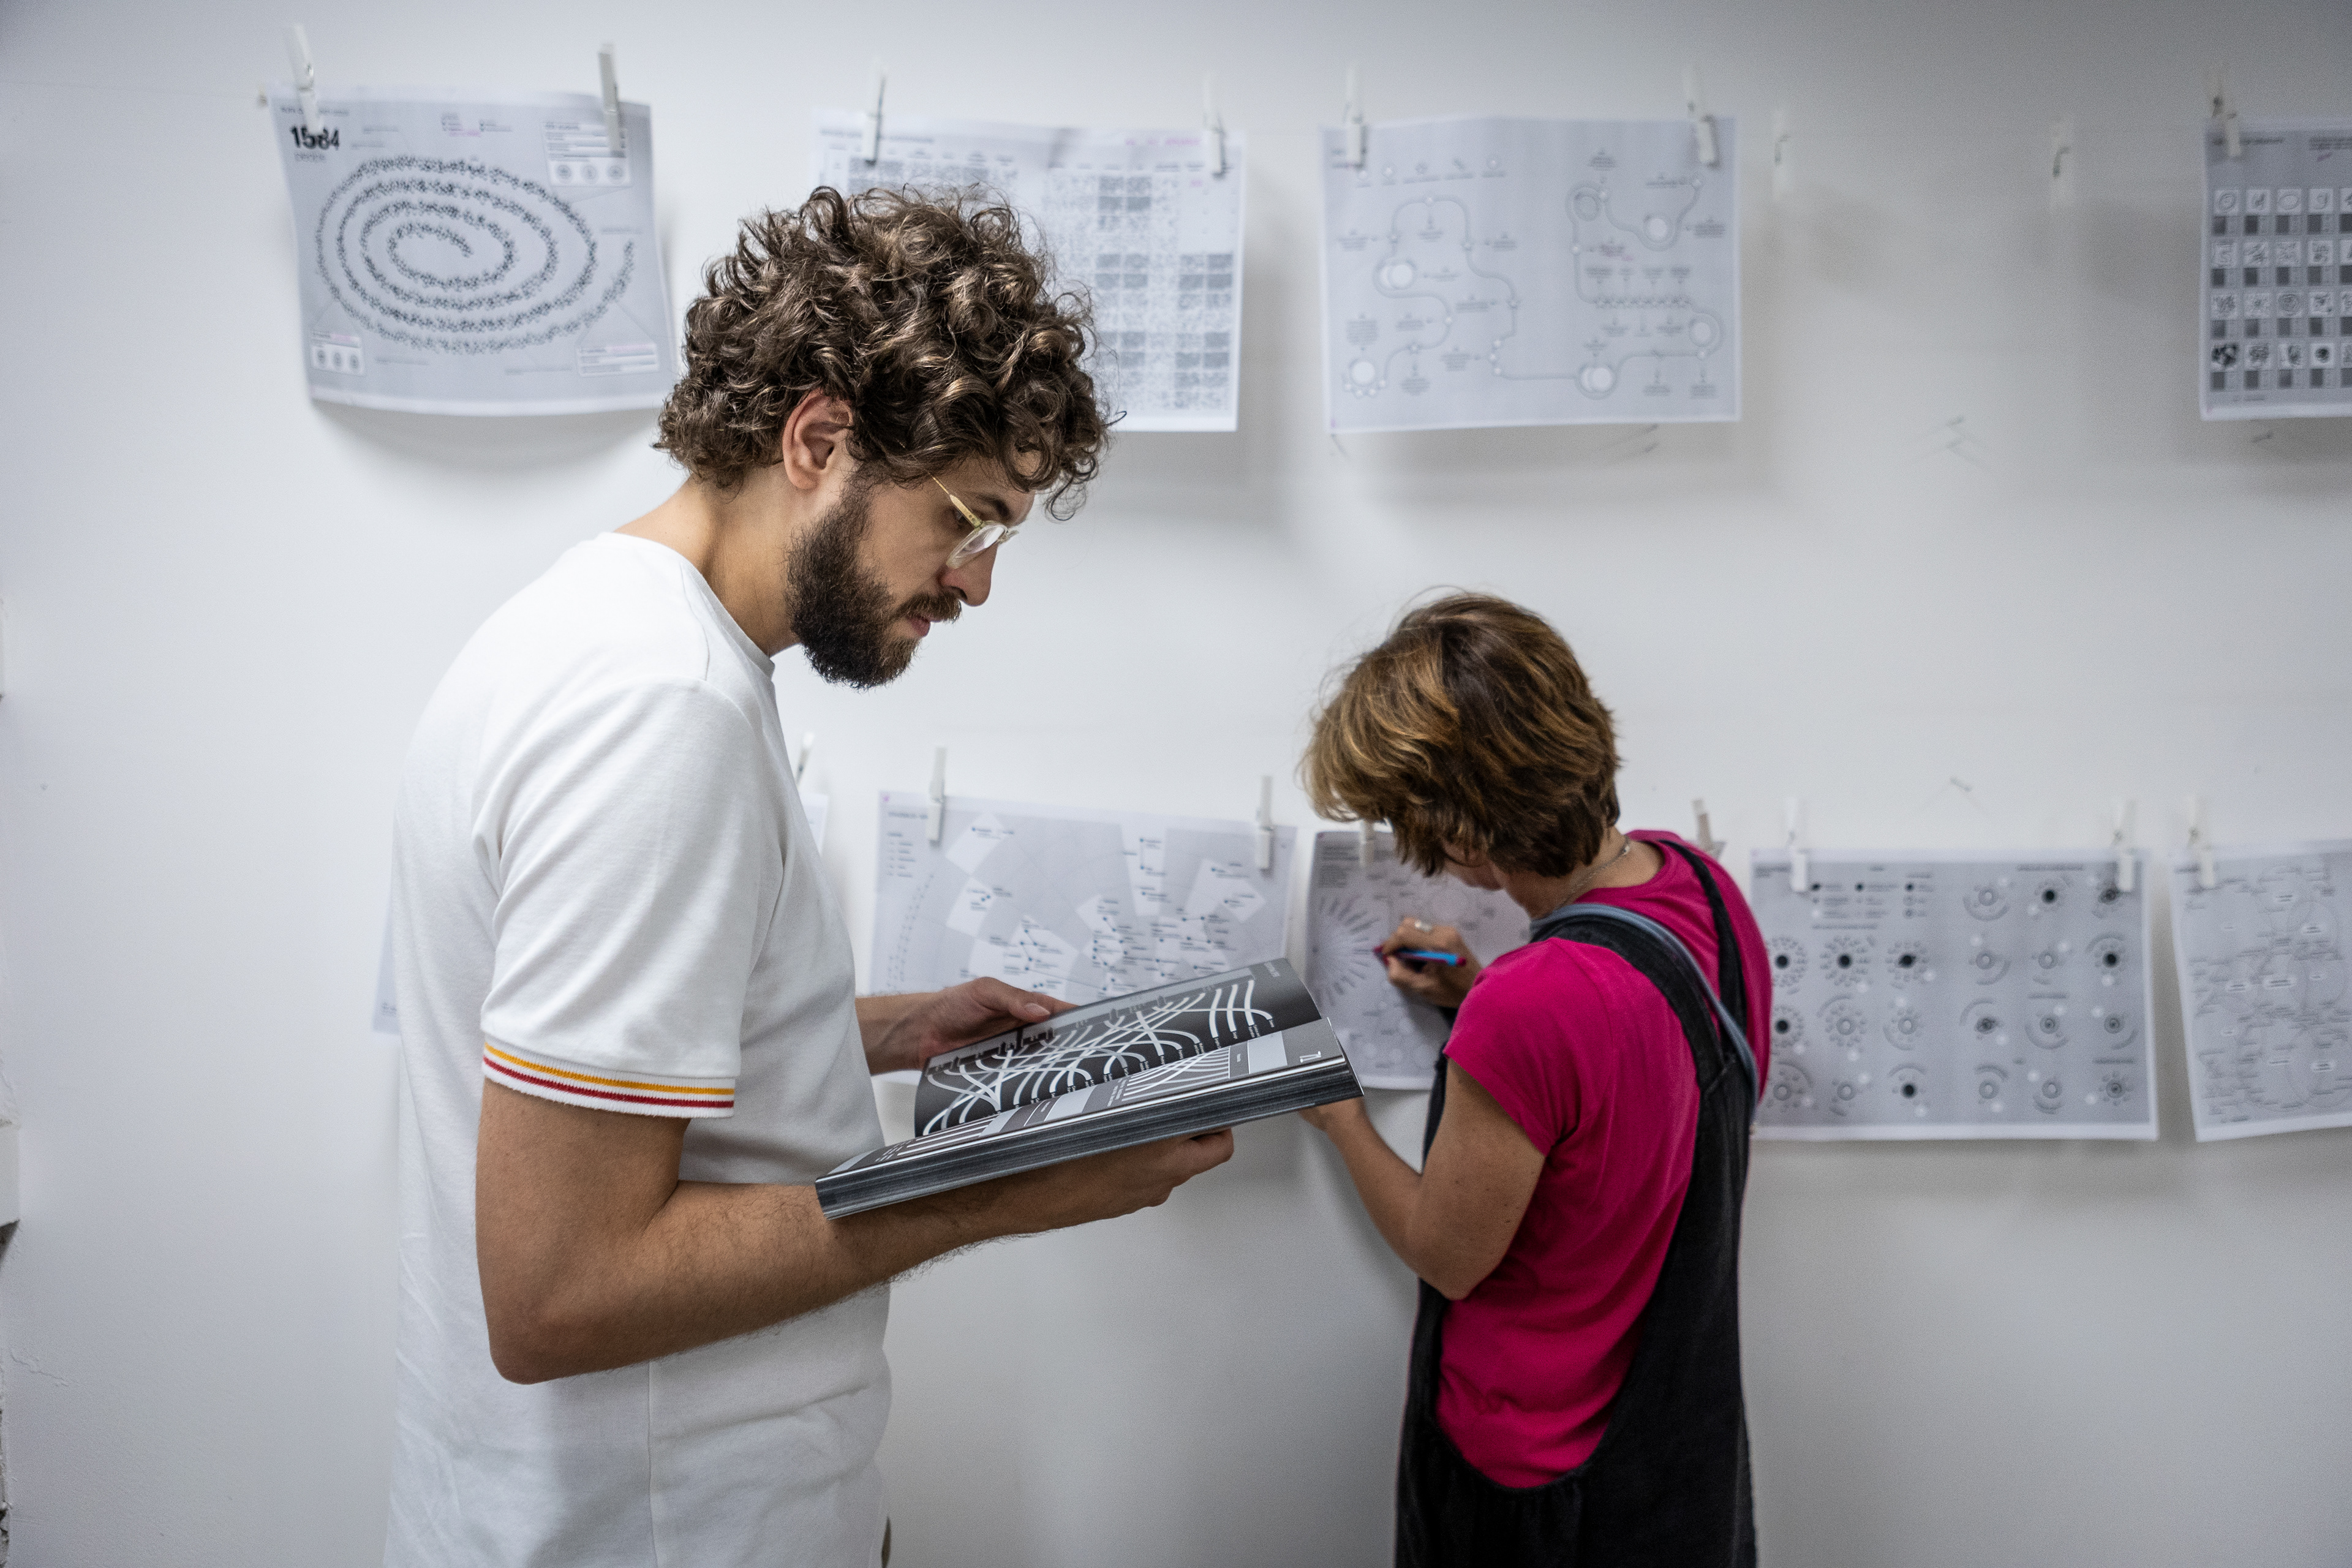
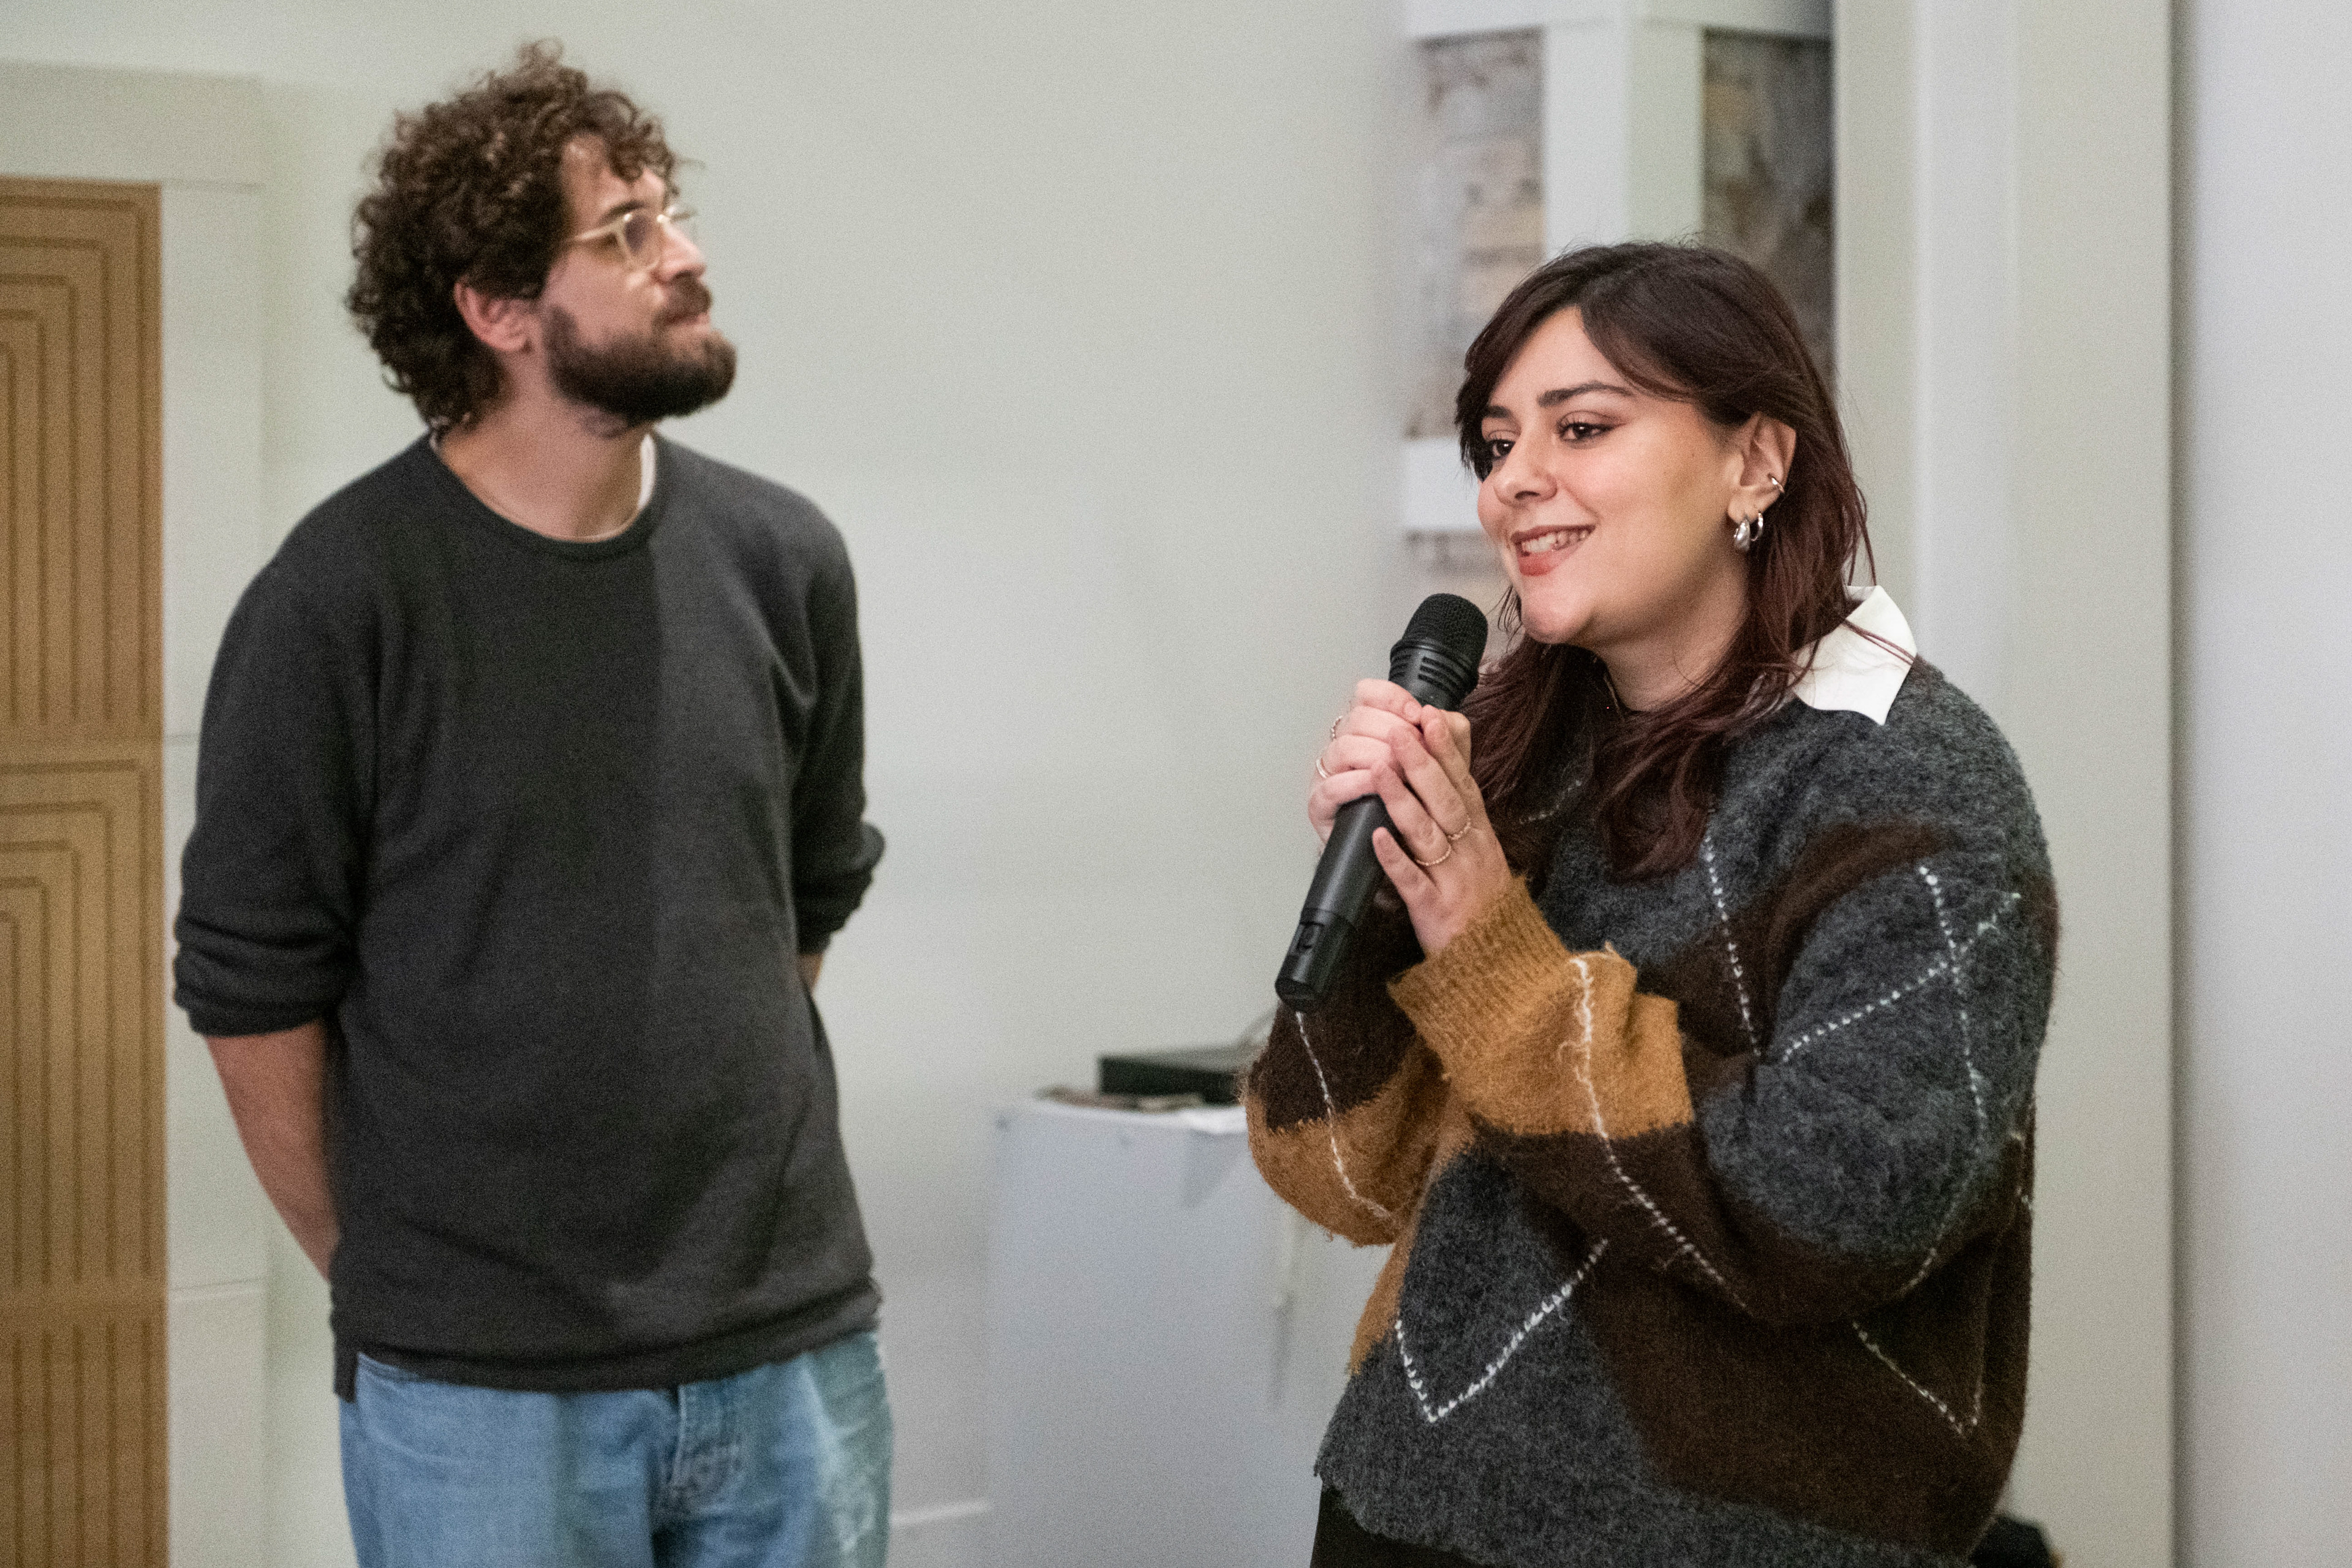
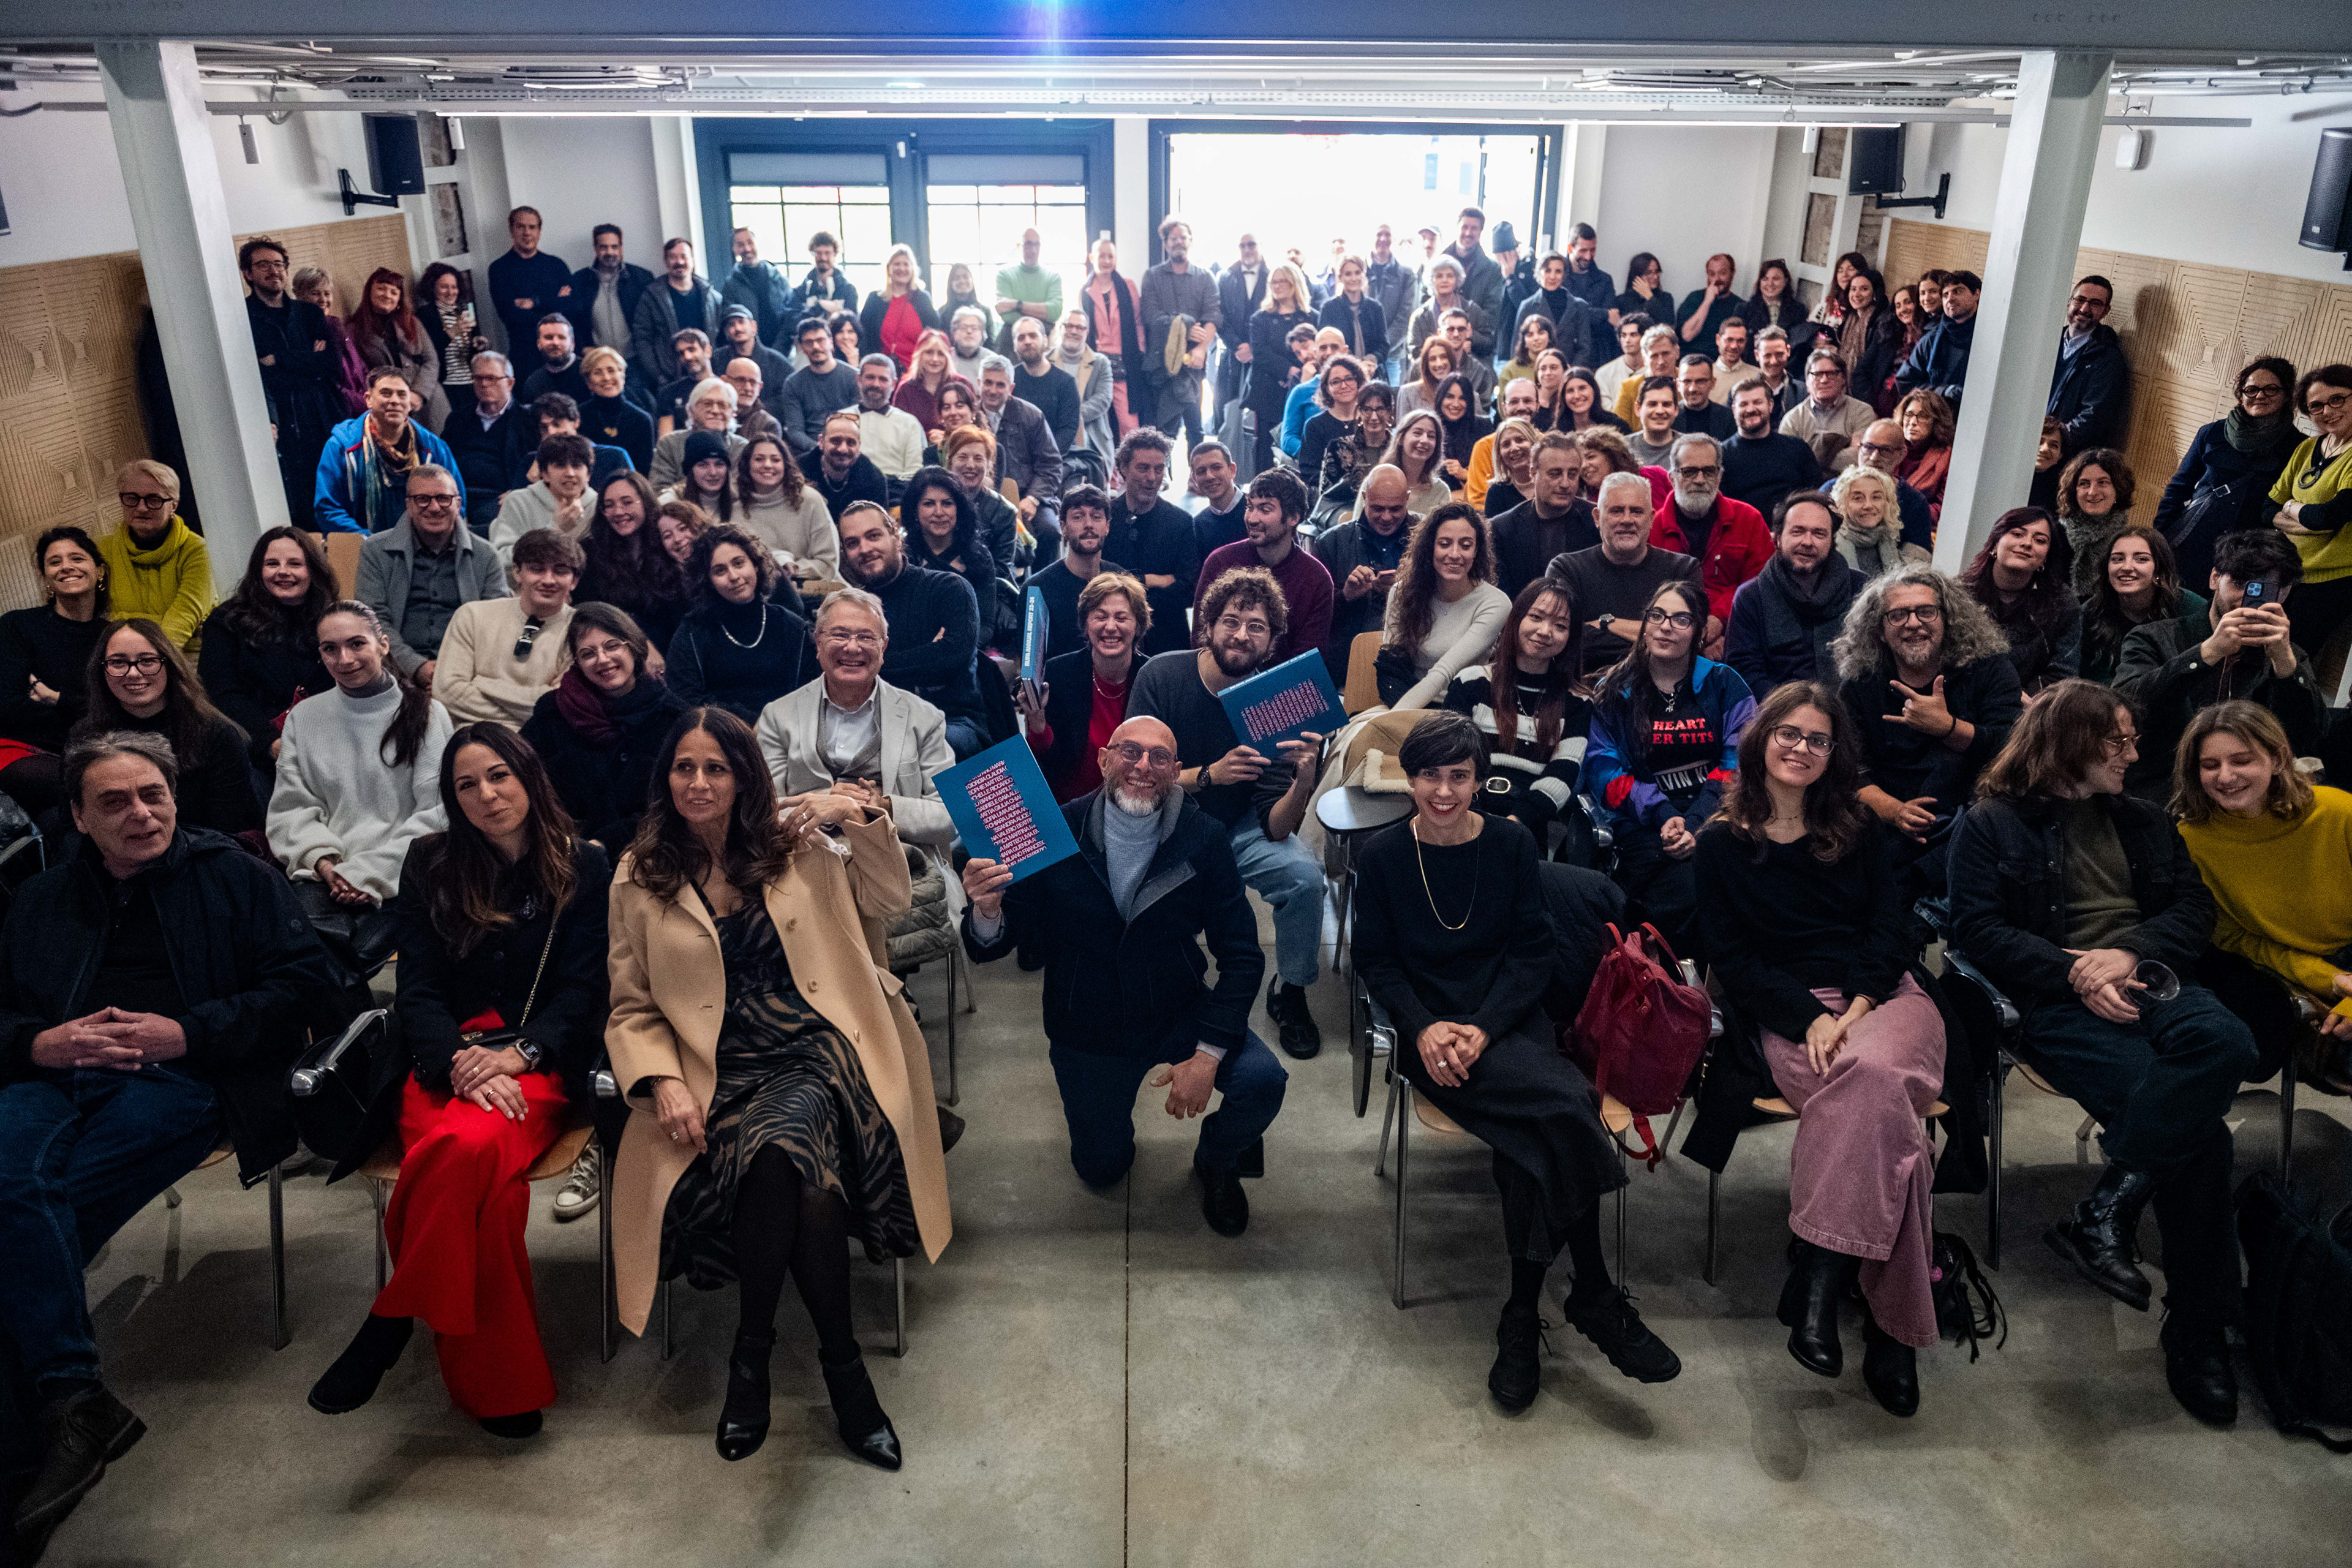
Photo credits Ammodo Studio, Claudia Rolando, Marta Ferro, Luca Carbone